


Do you ever struggle to formulate hypotheses based on your experimental expression data? You may be comparing results from healthy versus tumor cell lines or treated versus untreated samples. What do the differences between expression patterns in the data mean? Many of us struggle to make biological sense of our RNA-seq or microarray data. The massive amount of expression data generated from experiments leaves us with thousands of data points but often no understanding of their biological meaning.
Advanced pathway analysis is an excellent way to gain a deeper understanding of expression data and experimental results. Here we offer three easy ways to go from expression data to pathway analysis so you can give your experimental data biological context to start gathering meaningful insights.
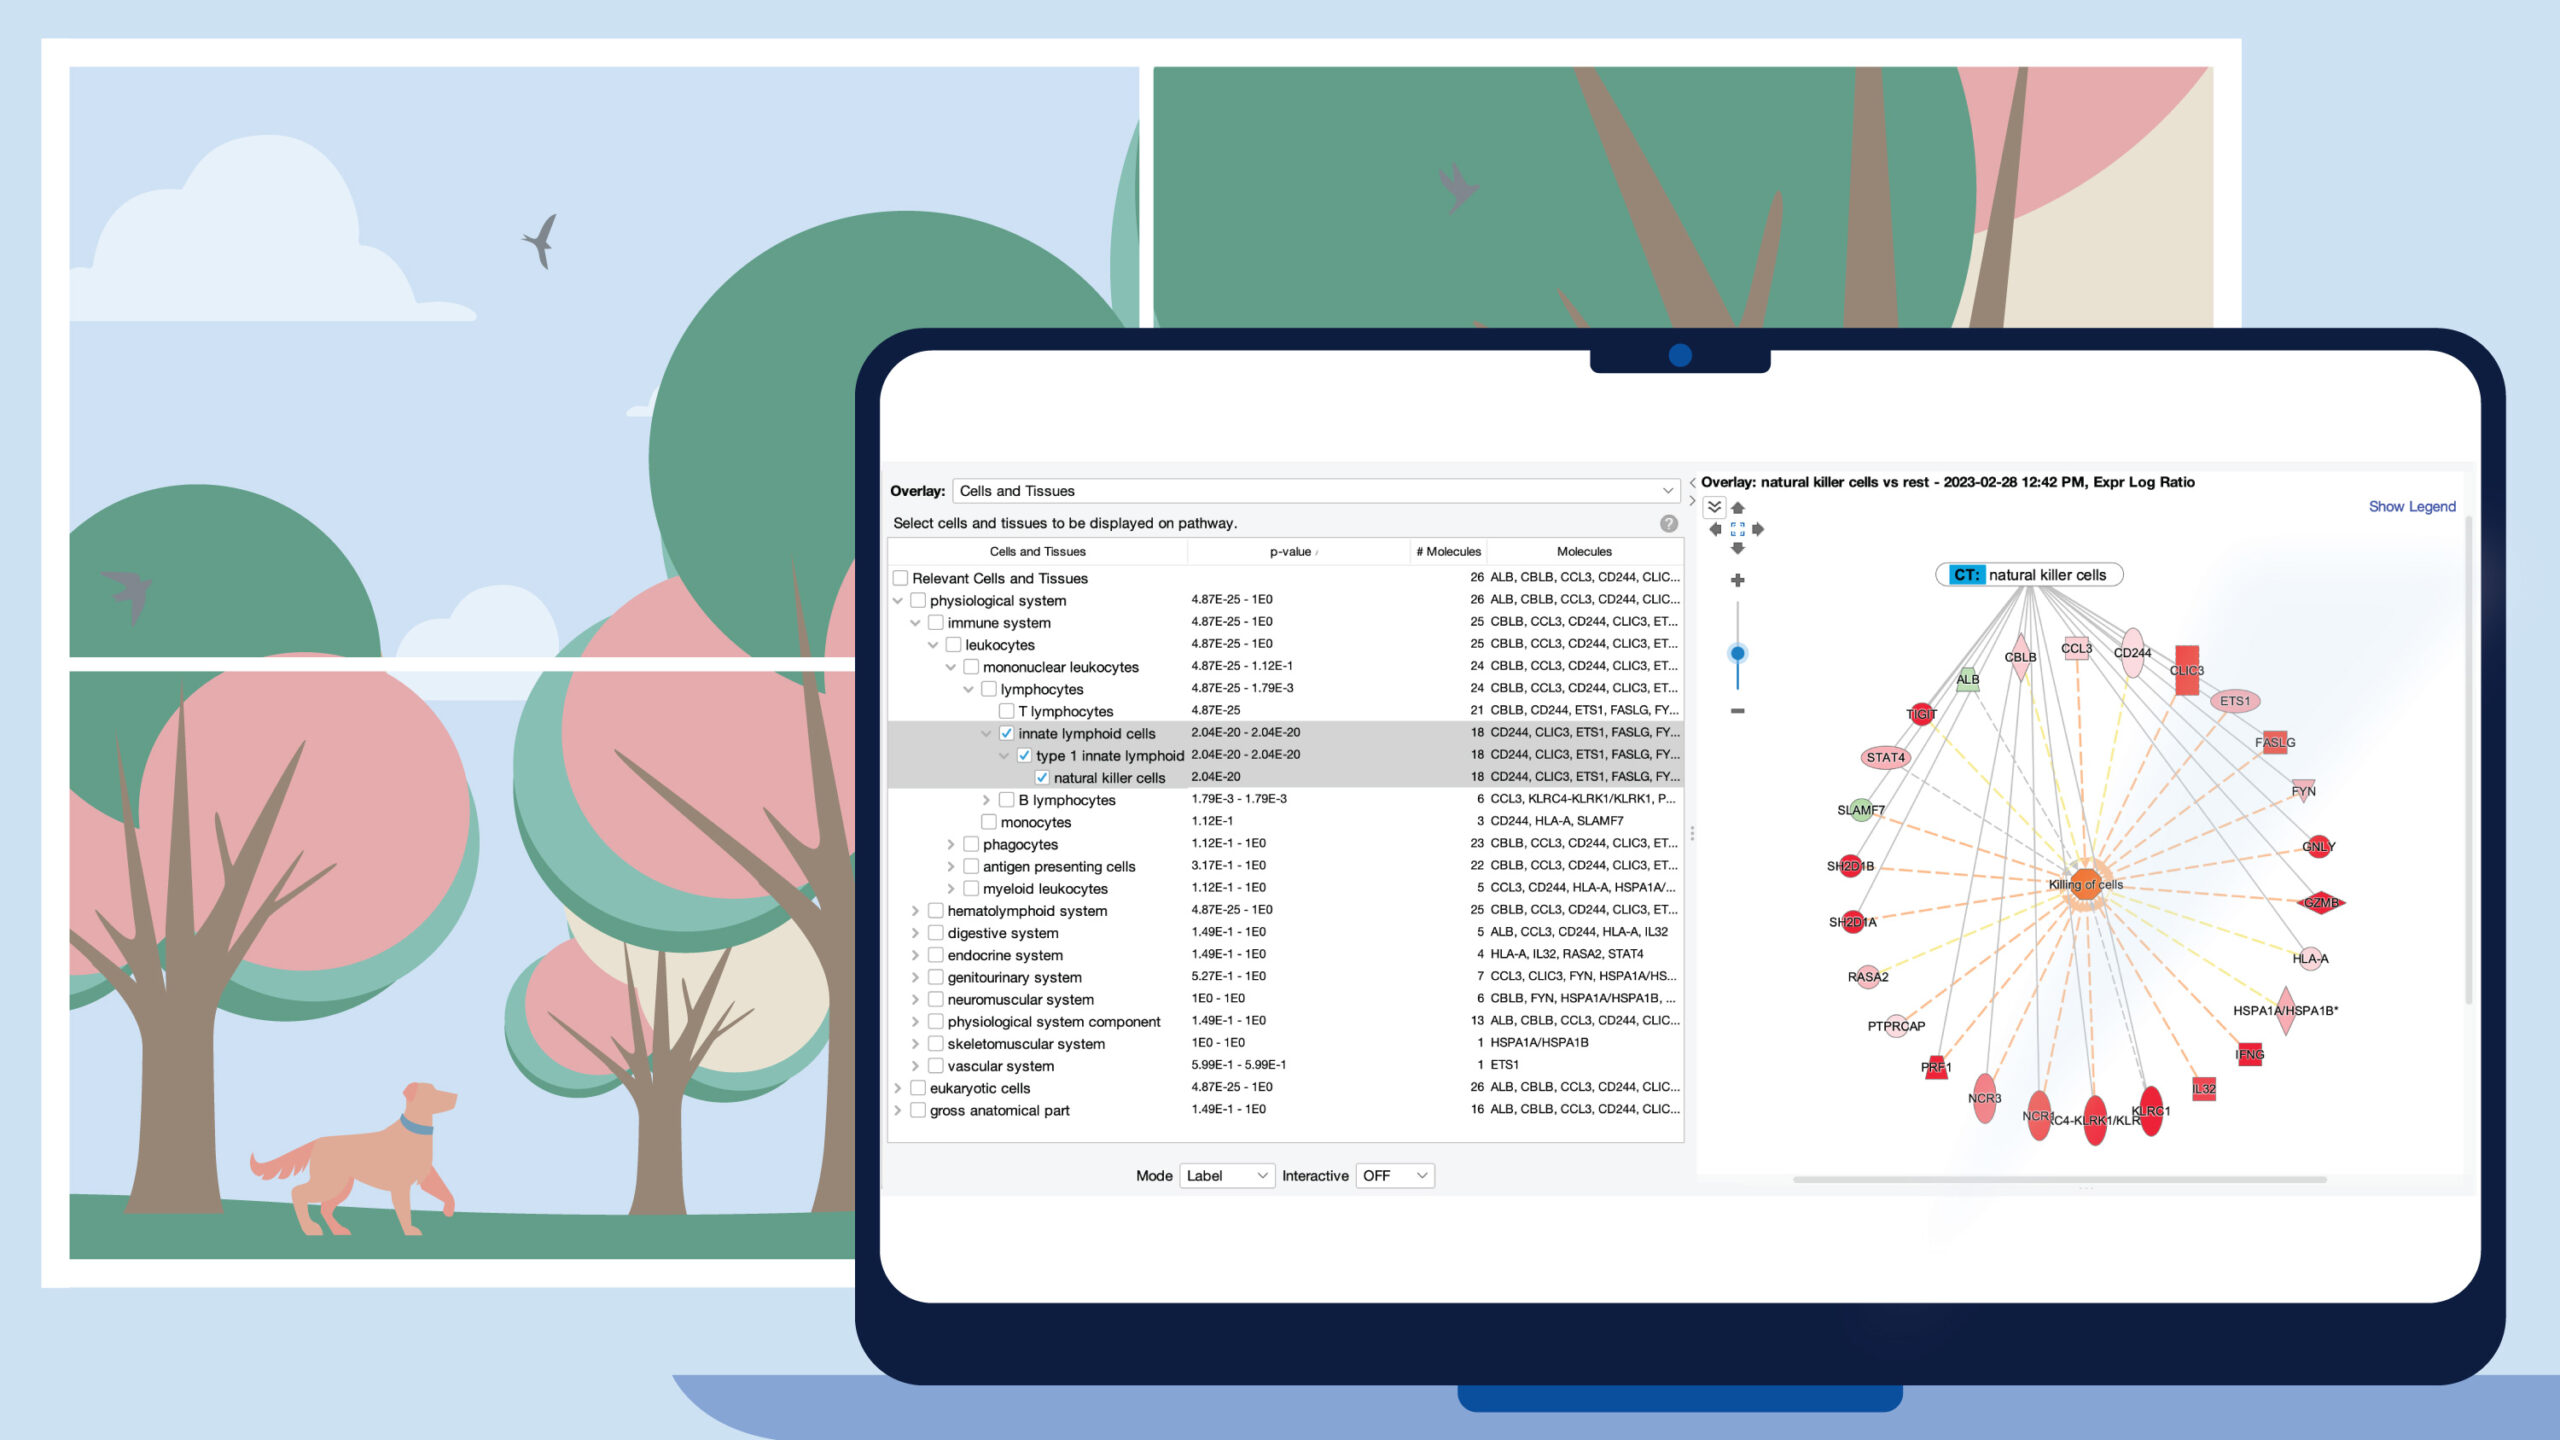
QIAGEN Ingenuity Pathway Analysis (IPA) is a popular tool for analyzing, comparing and contextualizing differential gene expression results from experiments in human, mouse or rat, among other organisms. QIAGEN CLC Genomics Workbench has convenient tools for processing raw data from RNA-seq or microarray experiments and performing differential gene expression analysis. In addition, with an IPA license and the Ingenuity Pathway Analysis Pathway plugin installed, you can upload results to IPA directly. By combining QIAGEN CLC Genomics Workbench with QIAGEN IPA, we offer a versatile platform for linking various instrument readout formats to biological insights.
These are the three most common use cases we see among our customers:
Use case 1: FASTQ data to IPA
Typical experiments you may be running involve sending RNA (mRNA, miRNA, lncRNA, etc.) from treatment and control samples to an NGS sequencing facility. After sequencing, you perform bioinformatics analysis using QIAGEN CLC Genomics Workbench on the FASTQ file(s) returned by the facility. First, you can do QC and trimming using the Prepare Raw Data workflow. Samples that meet QC criteria are then associated with metadata describing the experimental setup. You can identify differentially expressed genes (DEGs) using the RNA-Seq and Differential Gene Expression Analysis workflow. Differential gene expression analysis is based on the fit of a Generalized Linear Model with a negative binomial distribution, like the approaches taken by the popular tools EdgeR (Robinson et al., 2010) and DESeq2 (Love et al., 2014). Paired designs are supported, and it is possible to control for batch effects. You can then upload DEGs directly to IPA for additional analysis, comparison and contextualization. Analyze Expression Data and Upload Comparisons to IPA provides a convenient Sample to Insight workflow.
See also our manual on RNA-seq and small RNA analysis.
Use case 2: RNA-seq expression data to IPA
In this use case, the sequencing facility processes the raw FASTQ files and returns an expression matrix file, which takes up much less space than FASTQ files do. You can import expression matrices using the Import Expression Matrix tool in QIAGEN CLC Genomics Workbench. Then you can apply QC criteria, associate metadata and compare the experimental groups as described for use case 1. This use case is also supported by a Sample to Insight workflow: Analyze Count Matrix and Upload Comparisons to IPA.
Use case 3: Microarray expression data to IPA
In this third scenario, the samples have been processed on microarrays, not using NGS. Various generic and vendor-specific formats are supported in QIAGEN CLC Genomics Workbench. Steps include setting up a microarray experiment to group the samples, followed by transforming and normalizing the expression data and running a statistical test to identify differential expression. Several tests are available, including proportion-based tests, t-tests and ANOVA. Filtered DEGs can be uploaded to IPA for pathway analysis as described for use case 1.
Ready to give it a try?
QIAGEN Digital Insights bioinformatics tools for transcriptomics support microarray and RNA-seq data analysis with a variety of specialized tools. They enable you quickly go from raw instrument output to biological insights, as well as compare to over 100,000 curated public datasets. Learn more and request a consultation about our portfolio of tools for biomarker and target discovery that support expression data analysis. Ready to try these applications? Request a trial of QIGEN CLC Genomics Workbench and QIAGEN IPA to see how these tools can work together to streamline your insights from expression data.
References:
Resources:
Plugin:
Blogs:
Best practices for RNA-seq data analysis
Compare biological expression results with QIAGEN IPA Analysis Match
Webinars:
Training on RNA-seq and pathway analysis
Example analysis performed using QIAGEN CLC Genomics Workbench:
Tutorials:
Expression analysis using RNA-Seq data
Advanced RNA-seq analysis with upload to IPA
Microarray-based expression analysis
Building workflows in QIAGEN CLC Genomics Workbench video tutorials
How to include external applications to QIAGEN CLC Genomics Server video tutorials