


'Omics research has made it easy to gather large volumes of data on differentially expressed genes in various conditions. Changes in gene expression levels give an unprecedented birds-eye view on what functional changes are going on in a disease or biological process. However, this advantage comes with its own set of challenges. These extensive sets of important up- and down-regulated genes come without biological context and are impossible to interpret manually. This is where causal pathway analysis is an invaluable approach to identify and group interconnected genes in a network or pathway, and annotate functional changes brought about by the differences in gene expression. The combination of human-curated biological knowledge from databases, statistical analysis and computational modeling allow us to make these connections easily, with the right software tools.
The most essential factor in determining the suitability of the tool is the quality of the knowledge it holds on molecular connections and the specific kind of interactions that form relationships among biological molecules. This is where most freely-available interaction/knowledge databases fail. They are not updated on a regular basis and therefore lack the most recently discovered molecular interactions. More importantly, they also lack causality – whether a gene or chemical has an activating or inhibitory effect on another gene or pathway or disease.
This is where QIAGEN Ingenuity Pathway Analysis (IPA) reigns supreme. The database which supports IPA, the QIAGEN Knowledge Base, currently contains over 7 million findings and is continually updated, with an average of over 1000 new findings added daily. Our scientists read the biomedical literature and capture the granular context and causality in each curated paper which they enter into the knowledge base.
Use these top five tips on performing pathway analysis in QIAGEN IPA, and you can master pathway analysis in no time:
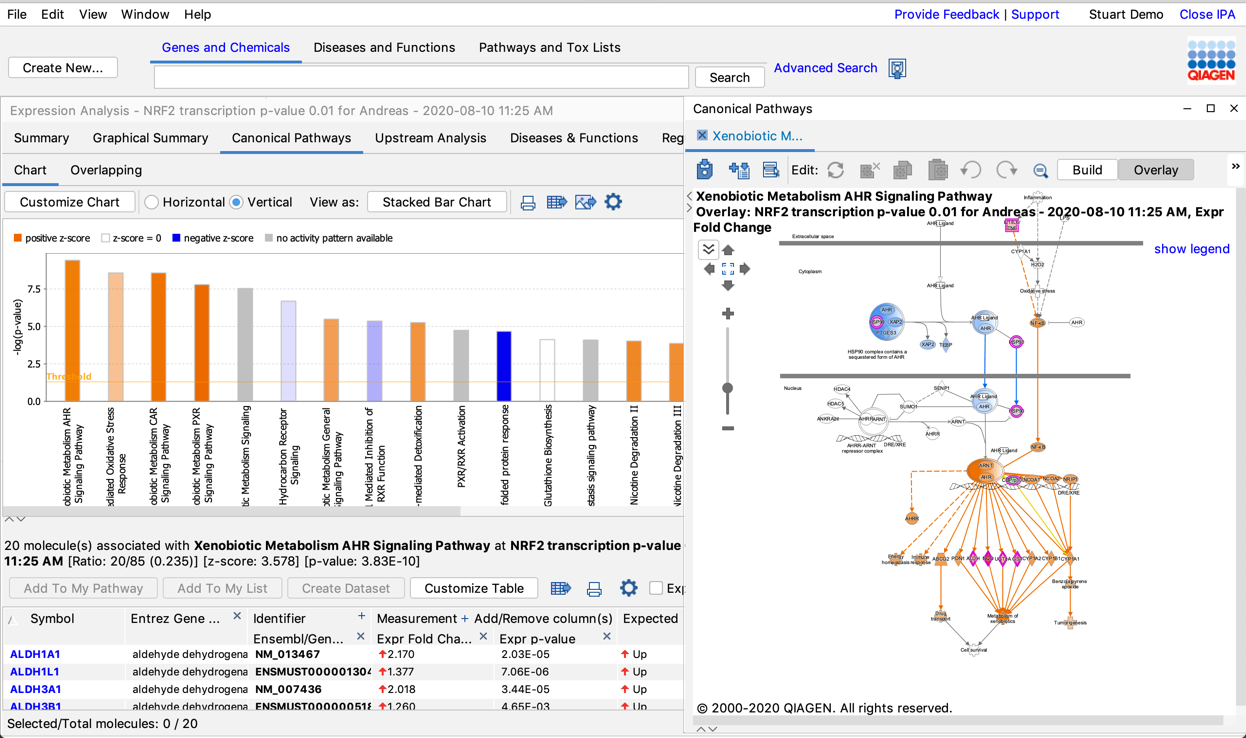
1. Pathway Activation Prediction: QIAGEN IPA goes beyond basic pathway analysis. Other applications, such as DAVID, simply tell you which signaling pathways are enriched from a limited collection of such pathways, yet don't tell you whether the overlapping genes are up- or down-regulated in your dataset – information which is crucial to achieving deeper insights into your data. IPA analyzes your data in the context of the most extensively curated set of signaling and metabolic pathways. Not only will IPA identify the most significant pathways, but it also tells you which pathways are predicted to be activated or inhibited based on your data. This is a key feature that helps you understand the biological mechanisms underlying your data.
2. Regulatory Network Analysis: After identifying significant pathways and systems based on your data, one of the next steps is to identify key regulators that are likely responsible for the changes observed in your data. IPA's Regulator Effects analysis enables you to understand regulatory networks by identifying key regulators upstream and how they drive the predicted downstream effects on biological and disease processes from your data. This provides additional insights by integrating Upstream Regulator results with Downstream Effects results. By connecting cause and effect, you can develop actionable hypotheses that explain what is occurring upstream – resulting in particular downstream phenotypic or functional outcomes.
3. Molecule Activity Predictor (MAP): Identifying networks or pathways that contain a gene or molecule of interest can be challenging, and digging deeper by identifying which of those networks are activated or inhibited is nearly impossible using many applications. QIAGEN IPA's MAP function allows you to interrogate sub-networks and Canonical Pathways and generate hypotheses by selecting a molecule of interest and indicate up- or down-regulation, simulating directional consequences in downstream molecules and the inferred activity upstream in the network or pathway.
4. IPA Analysis Match: Once you have a working hypothesis, one of the most time consuming and resource-intensive next steps is to validate your hypothesis experimentally. Fortunately, IPA's Analysis Match allows you to automatically identify datasets with significant similarities and differences from a library of over 65,000 curated analyses. This enables you to locate and compare results and better understand causal connections among diseases, genes and networks of upstream regulators in other biological settings. This unique feature allows you to strengthen and verify your existing hypothesis and discover new biological insights by comparing your data to published, peer-reviewed results.
Download our brochure to learn more about QIAGEN IPA with Analysis Match

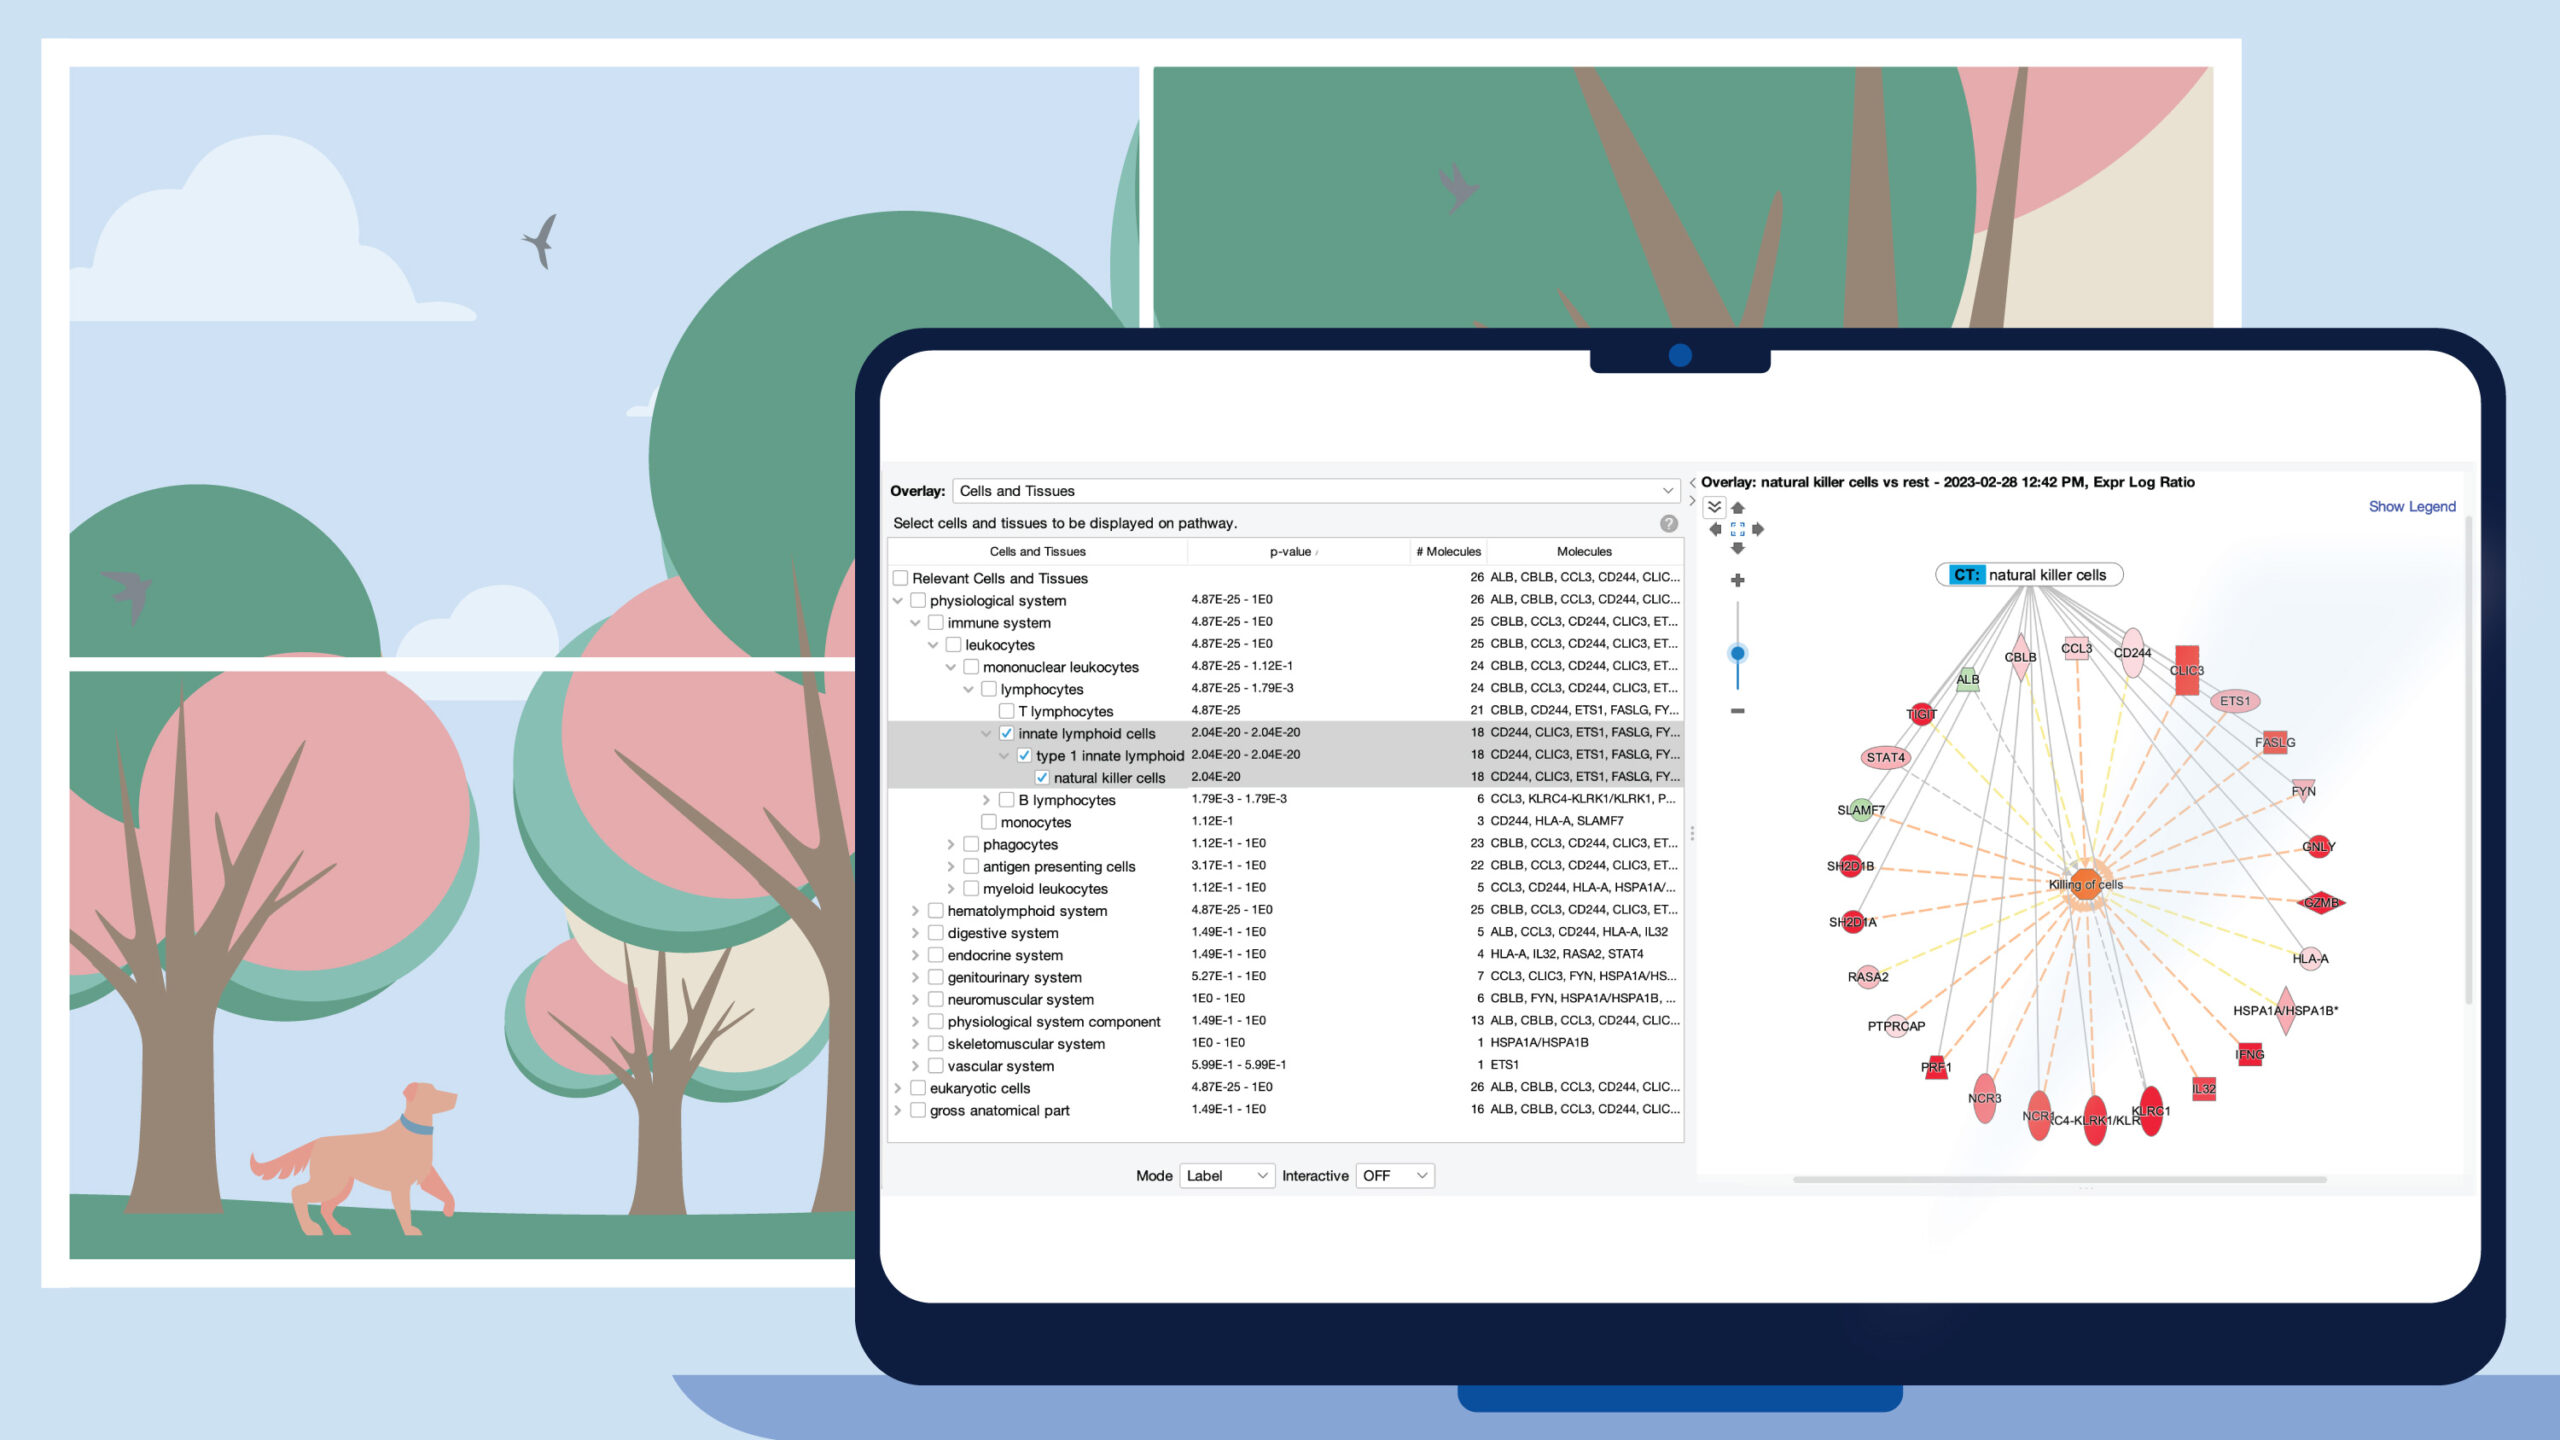
5. IPA with Land Explorer: Searching for information about a gene of interest in the public domain can take hours, and requires filtering and evaluating a large amount of data. Now with the click of a button, you can explore expertly-curated 'omics data on over 500,000 biological samples across tens of thousands of genes, with robust visualizations. Jump from a gene of interest in QIAGEN IPA to discover its expression in various tissues and cell types with Land Explorer. Explore the diseases and treatment contexts in which it is up-or-down-regulated. Visualize how mutations correlate with changes in expression, the effect of mutations on clinical outcomes and survival and much more. All this information with customizable visualizations is instantly at your fingertips, from a single software interface.
Download our brochure to learn more about QIAGEN IPA with Land Explorer

With these unique features, you can perform your pathway analysis like a pro and be part of the QIAGEN IPA expert community. With more than 7 million findings, 40 integrated databases, over 4500 publications citing IPA each year and regular product feature updates, QIAGEN IPA is the best-suited pathway analysis tool to quickly and easily get you deeper insights into your biological data.
Don’t have QIAGEN IPA, or perhaps you are missing the latest features? Request a 14-day trial now.