


For few areas of genomics, do best practices evolve as quickly and continuously as for RNA-seq applications.
As a consequence of the rapid development within RNA-seq, researchers struggle to ensure that their analysis pipelines meet the latest standards. This typically means testing and integrating the best performers among a growing number of analysis solutions. And in the daily routine users often run a mix of different tools for the respective analysis step they perform best, from read mapping through isoform quantification to the detection of differential abundance.
RNA-seq analysis is a declared focus area for us. Users of CLC Genomics Workbench and Biomedical Genomics Workbench rely on us to constantly evaluate emerging bioinformatics approaches and integrate leading approaches into our solutions in a way that follows modern design control and quality assurance criteria.
We’re here sharing some of the recent improvements and underlying methods implemented into our RNA-seq solution.
Reads are simultaneously mapped to the genome and the transcriptome before being combined into a unified picture of expression. This brings two advantages:
Stranded library preparation reduces the uncertainty associated with assigning a read to an isoform, and can reveal antisense regulation of a gene. To account for imperfect efficiency of the protocol, reads are mapped to both strands, and those with a highest scoring alignment in the incorrect orientation are filtered away.
A typical RNA sequencing read could originate from several isoforms of a gene. An Expectation-Maximization algorithm, similar to that of RSEM, is used to determine the actual expressed isoform. The algorithm generalizes the human intuition that if some reads can only originate from isoform A or B, and others can only originate from isoform B or C, then it is most likely that B is expressed.


Results on the benchmark of Teng et al. (2016) showing the consistency of isoform quantification (left) and the accuracy of detected fold changes (right) for several open source methods and for QIAGEN. In both plots, the x-axis shows the expression level, and the performance of all methods improves for isoforms with higher expression. Perfect quantification would be the line y=0 for the plot on the left, and y=1 for the plot on the right. Flux Capacitor, used by the GTEx consortium, performs worst on these benchmarks.
The QIAGEN quantification approach overlaps with the best performing open source tool, RSEM. Data for the open source methods were kindly provided by the authors of the benchmark.
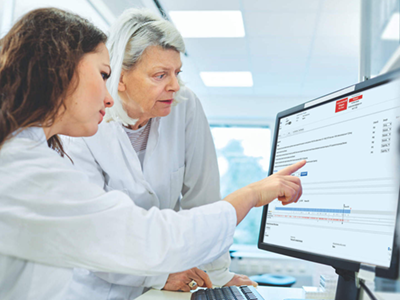
Samples can be associated with editable metadata at any stage of analysis. The information in the metadata is flowing automatically into statistics and visualizations to provide insight into patterns of expression and the presence of confounding factors.

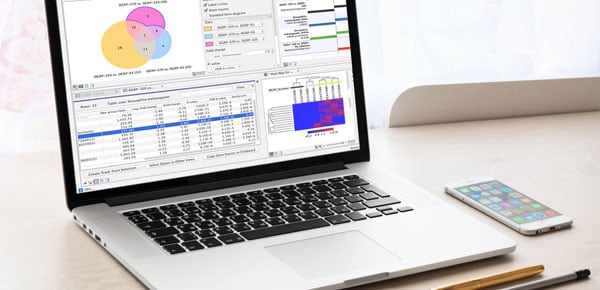
Intuitive analysis of differential expression between samples or sample groups. Results are depicted in tables, 2-D heat maps, or Venn diagrams. The results are linked and selecting a set of differentially expressed features reveals the respective information in other tables or plots. Differential expression of genes or transcripts can be compared among samples in the genome browser view (track list).

The genome browser view makes it easy to visualize genes or transcripts that are differentially expressed between samples. Color coding reveals differences in gene expression. Fold changes in expression are log-transformed and converted into color space.
Differential expression is detected based on metadata associated with samples. The statistics are based on the fit of a Generalized Linear Model with a negative binomial distribution, similar to EdgeR or DESeq2. The model supports paired designs, and can control for batch effects.
Differential expression can also be detected in exploratory studies where no replicates are available. In this case the algorithm shares data between isoforms with similar expression to estimate technical and biological variability.
We have carried out a comparative study to ensure that results generated with our solutions are in line with results generated with leading alternative methods.

Comparison to the DESeq2 benchmark of Love et al. (2014). This plot is equivalent to two panels of figure 6 of the paper by Love et al. but with QIAGEN added, and edgeR modified to run with quasi-likelihood testing. Data are simulated such that 20% of isoforms have a three-fold change in an experiment with 3 or 5 replicates (left and right plots respectively). The experiment is repeated six times. The sensitivity is the fraction of differentially expressed isoforms that are detected. The false discovery rate (FDR) is the fraction of isoforms that the method incorrectly calls as being differentially expressed. A perfect method would have highest possible sensitivity while lying on the black line (which is the target FDR, here set to 0.1). On this data DESeq and edgeR lie to the left of the target error rate, meaning they are being too conservative. DESeq2 and QIAGEN performs best on this benchmark with DESeq2 performing favourably with lower numbers of replicates. Differences between methods become smaller as the size of the fold change or number of replicates increase.
Teng, M., Love, M. I., Davis, C. A., Djebali, S., Dobin, A., et al. (2016). A benchmark for RNA-seq quantification pipelines. Genome Biology, 17(1), 74. doi:10.1186/s13059-016-0940-1
Love, M. I., Huber, W., & Anders, S. (2014). Moderated estimation of fold change and dispersion for RNA-seq data with DESeq2. Genome Biology, 15(12), 550. doi:10.1186/s13059-014-0550-8