


Microbial communities contribute more than half of all the cells our bodies are composed of. And not surprisingly, the taxonomic and genetic makeup of microbiomes is closely linked to the health of humans, animals and plants.
Yet especially the functional genetic composition of microbiomes is hard to establish and current metagenomics tools struggle with correctly predicting functional composition or changes in function between microbiome samples [Lindgreen et al. 2015].
What if you could access tools to de novo assemble metagenome data, reliably predict functional elements, and identify statistically significant changes in function between samples? And what if these tools were fully integrated into the industry standard for scientist-friendly NGS data analysis, and came along with a toolbox that has been optimized for microbiologists?
CLC Genomics Workbench, CLC Microbial Genomics Module and the MetaGeneMark plugin deliver superior performance, a fully integrated user experience and come bundled at a competitive price.
Accuracy of results
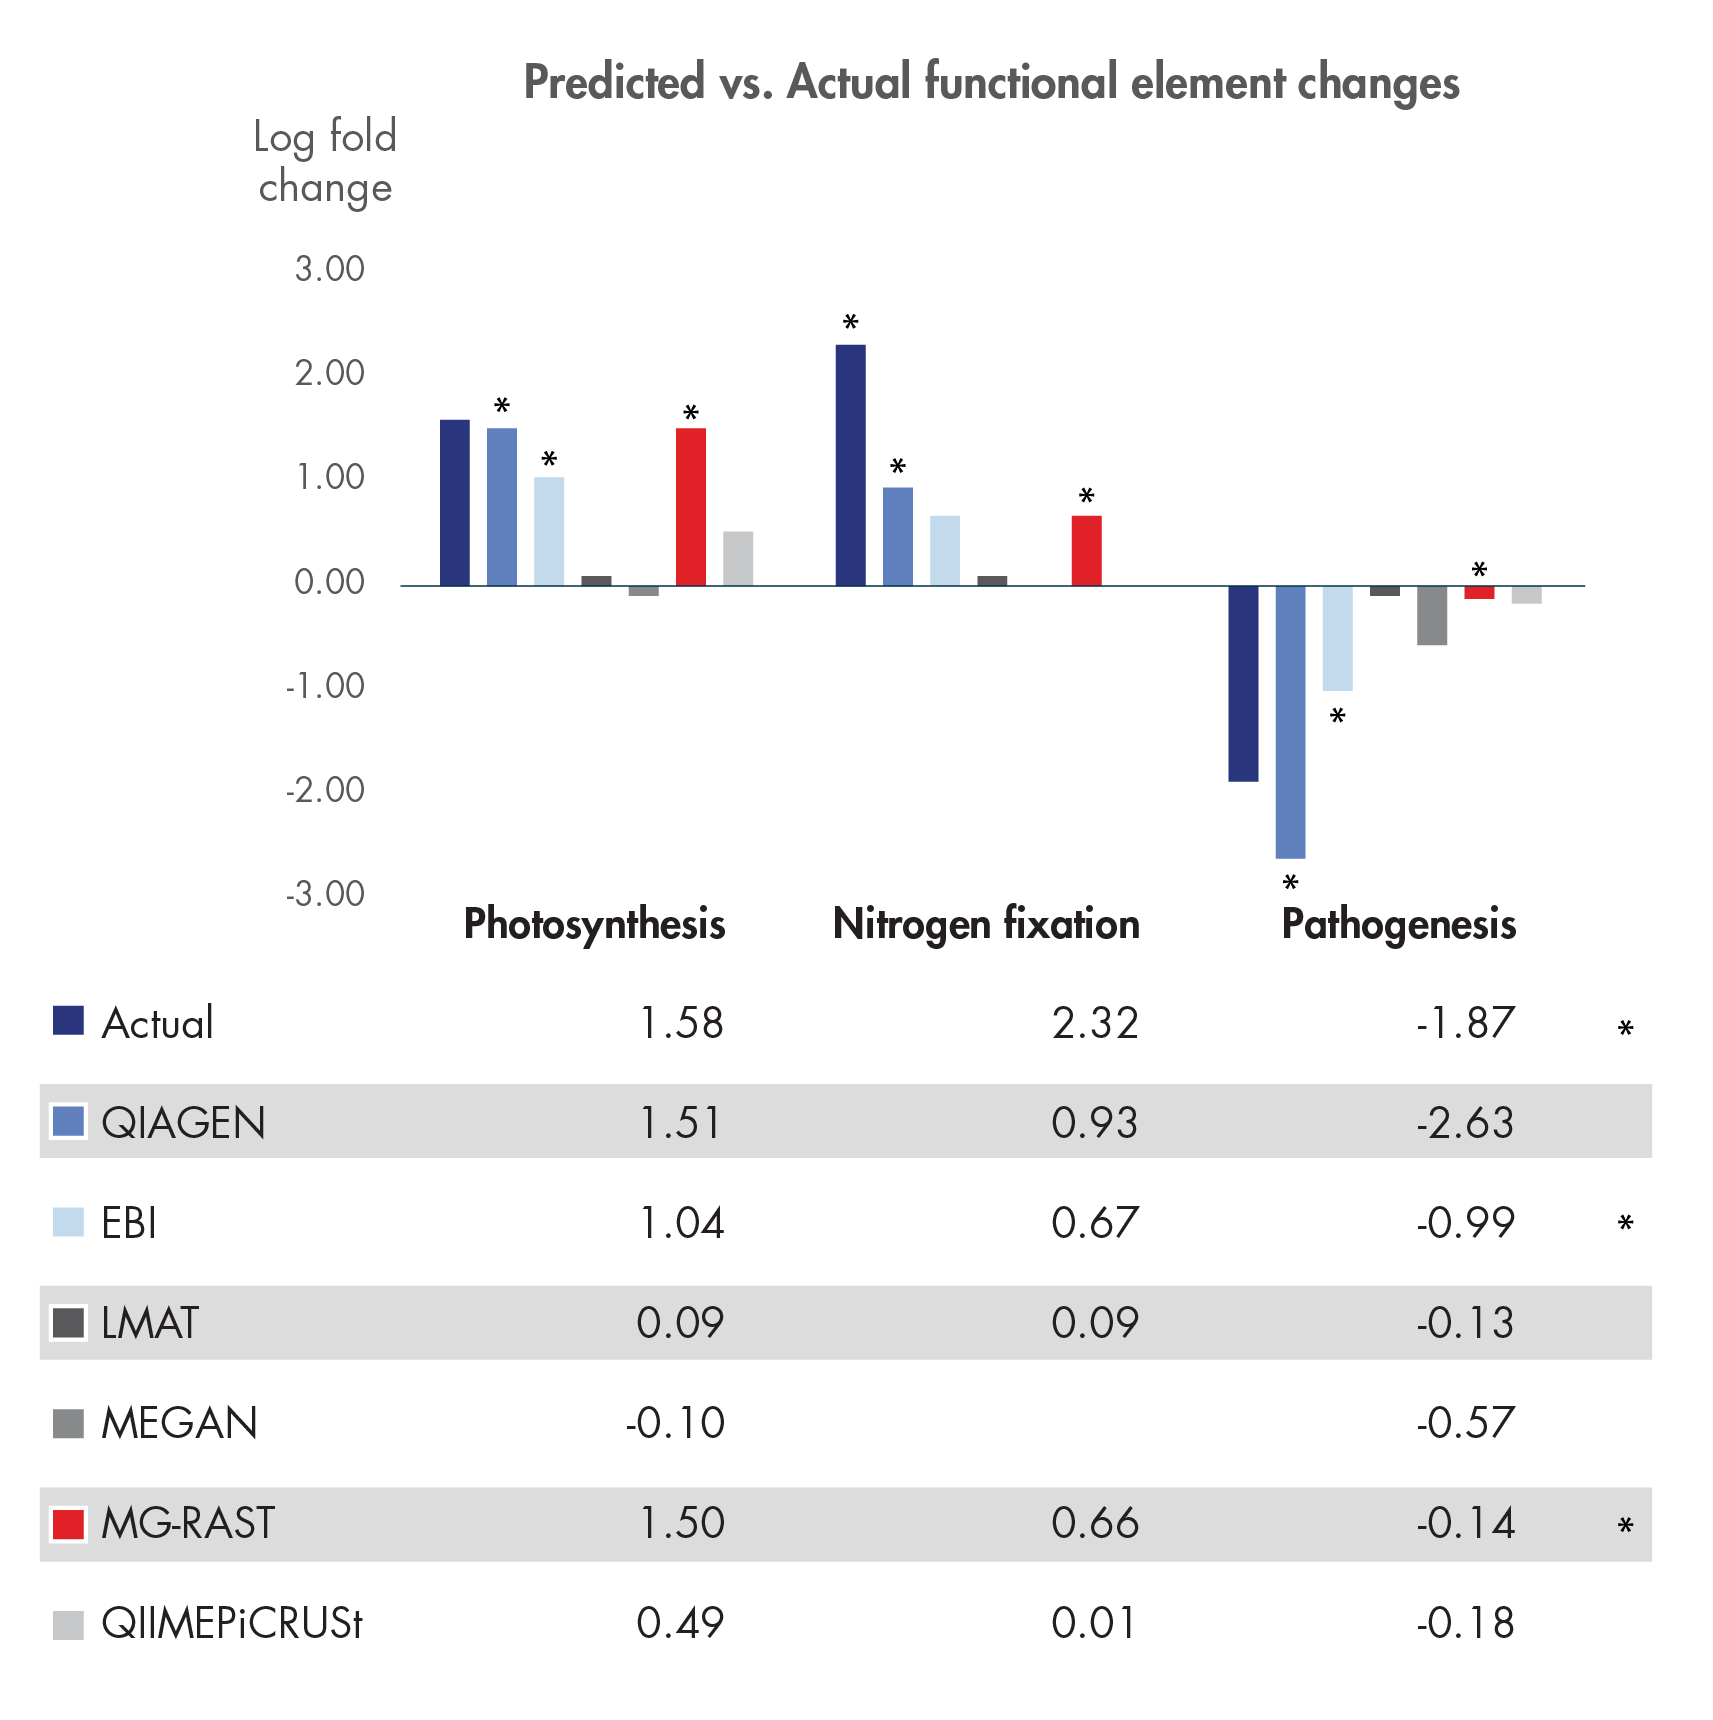
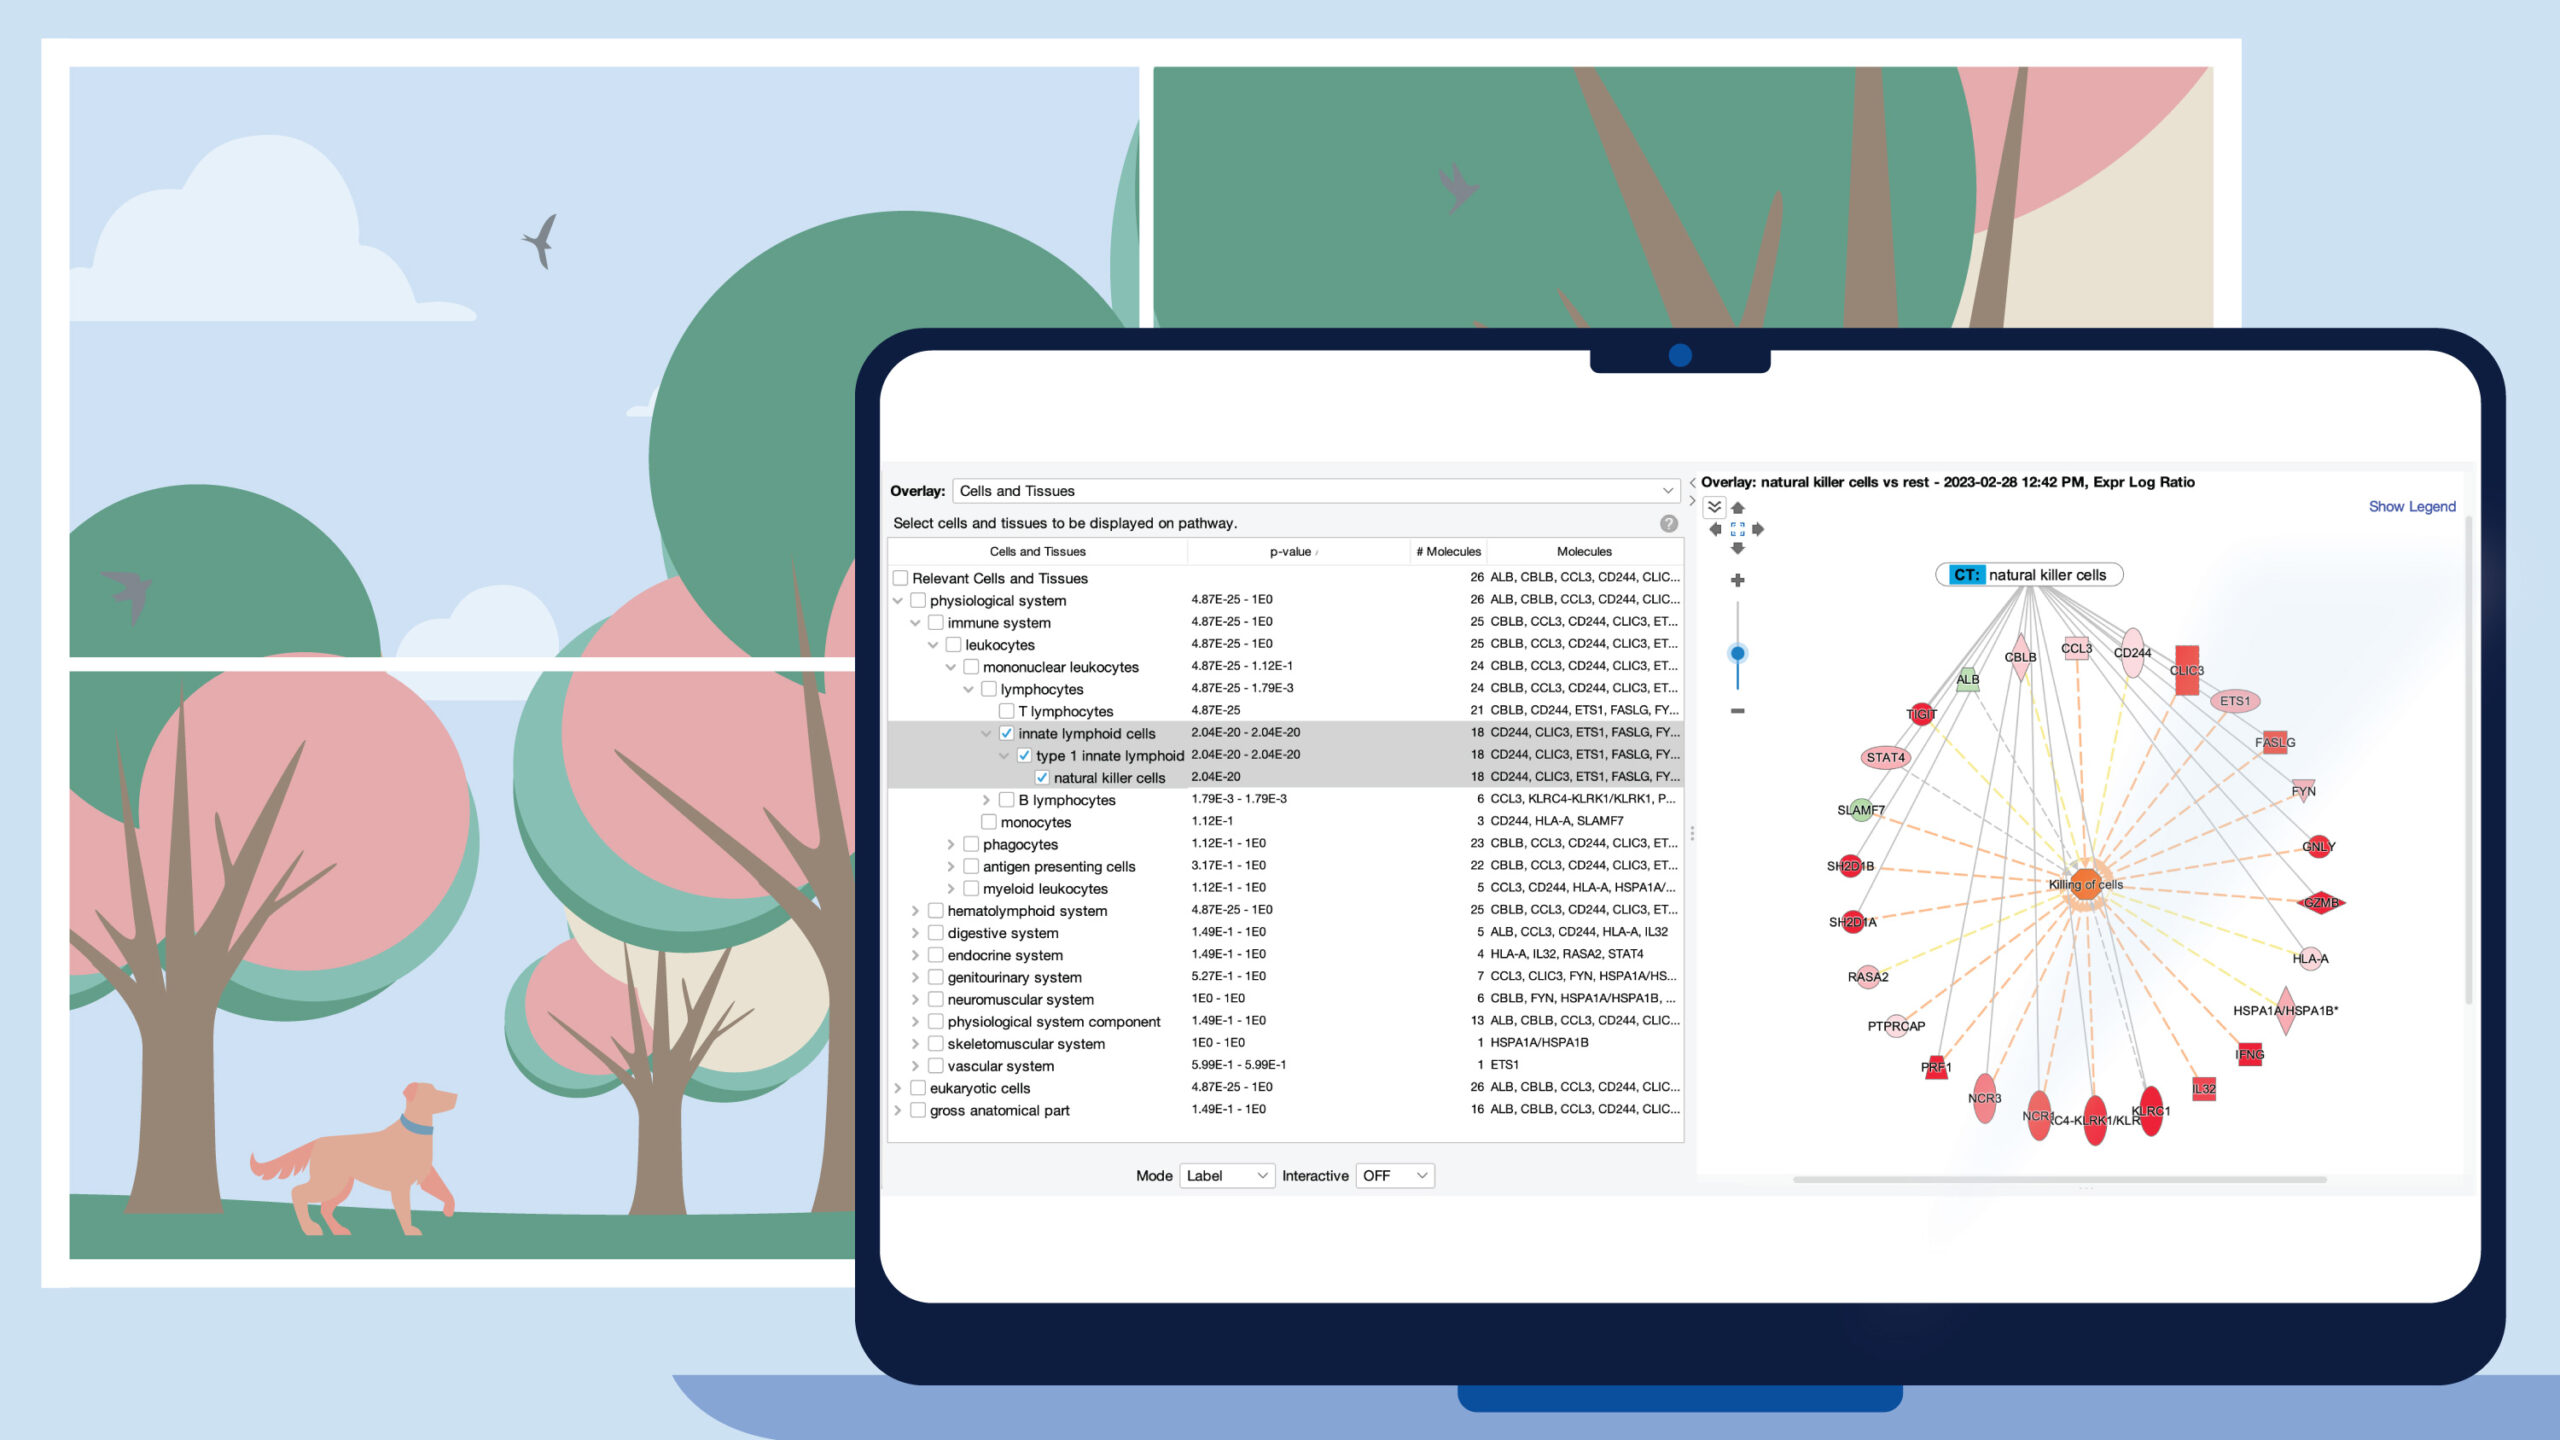
Figure 1. Assigning and tracking gene function in metagenomes with confidence.
Lindgreen et al. published a comprehensive, independent evaluation of 14 different whole metagenome analysis toolkits in Nature Scientific Reports in January 2016. We here compare our solution to the sole five toolkits out of the fourteen that allow functional metagenome analysis using the test data published by Lindgreen et al. Statistical comparison (Edge test performed in CLC Genomics Workbench) of pairwise differential abundance of the individual functional elements predicted in the two test communities detects a statistically significant difference for all of the three functional elements that were analyzed in the paper: photosynthesis, nitrogen fixation and pathogenesis (all p-values < 0.01). Fold-changes predicted using our tools capture the expected overall pattern of functional changes and estimate the actual fold-change with higher precision than any other tool in all three functional roles.
* indicates tools that consistently predicted changes correctly with statistically significance.
Detecting gene function in microbial communities based on metagenomic data is hard. Correctly measuring changes in the functional makeup between different metagenome samples is even harder.
Lindgreen et al. showed that most of the benchmarked open source tools failed to correctly predict such changes at levels that are statistically significant.
With our solution for microbial genomics you can more accurately detect and quantify functional elements in a sample. And the included statistical tools allow you to confidently measure statistically significant changes in function between samples.
Multi-sample comparison is used to detect functional changes between samples and to identify samples with similar or diverging functional genomic elements. Data can be grouped and analyzed in the context of your sample-metadata.
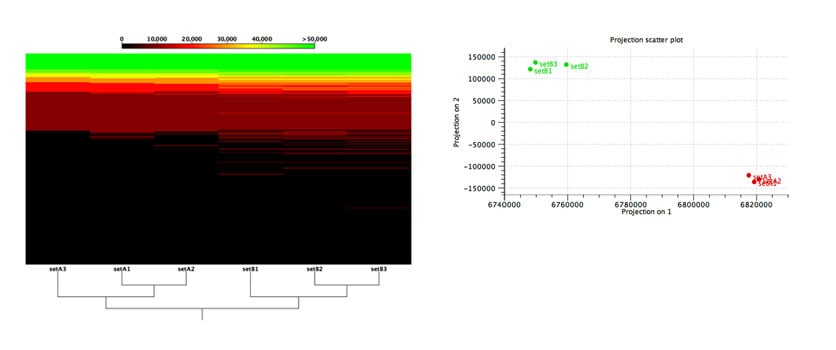
Figure 2: Functional comparison across microbiome samples.
Evaluation of an algorithm’s capabilities in detecting functional changes in metagenomes is notoriously hard because the ground truth is unknown and there exist no gold-standard datasets. To overcome these difficulties, Stinus Lindgreen et al. created six datasets from two synthetic microbial communities for his benchmarks: three (A1, A2 and A3) from the A community and three from the B community. To control the functional content, he created the two communities, A and B, with a selected set of species with known functional capabilities: Cyanobacteria (photosynthesis), Bradyrhizobium (nitrogen fixation) and Rhizobium (nitrogen fixation) were more abundant in community A, while a set of known pathogens where more abundant in community B.
As shown in Figure 2, our tools were able to reliably separate samples from the two different communities based on the relative abundance of their predicted functional content.
Our accurate assignment of gene function depends on a novel metagenome assembler producing higher quality assemblies compared to leading alternatives. Table 1 illustrates how our metagenome assembler compares favorably when it comes to misassemblies, InDels, mismatch errors, and other quality metrics.
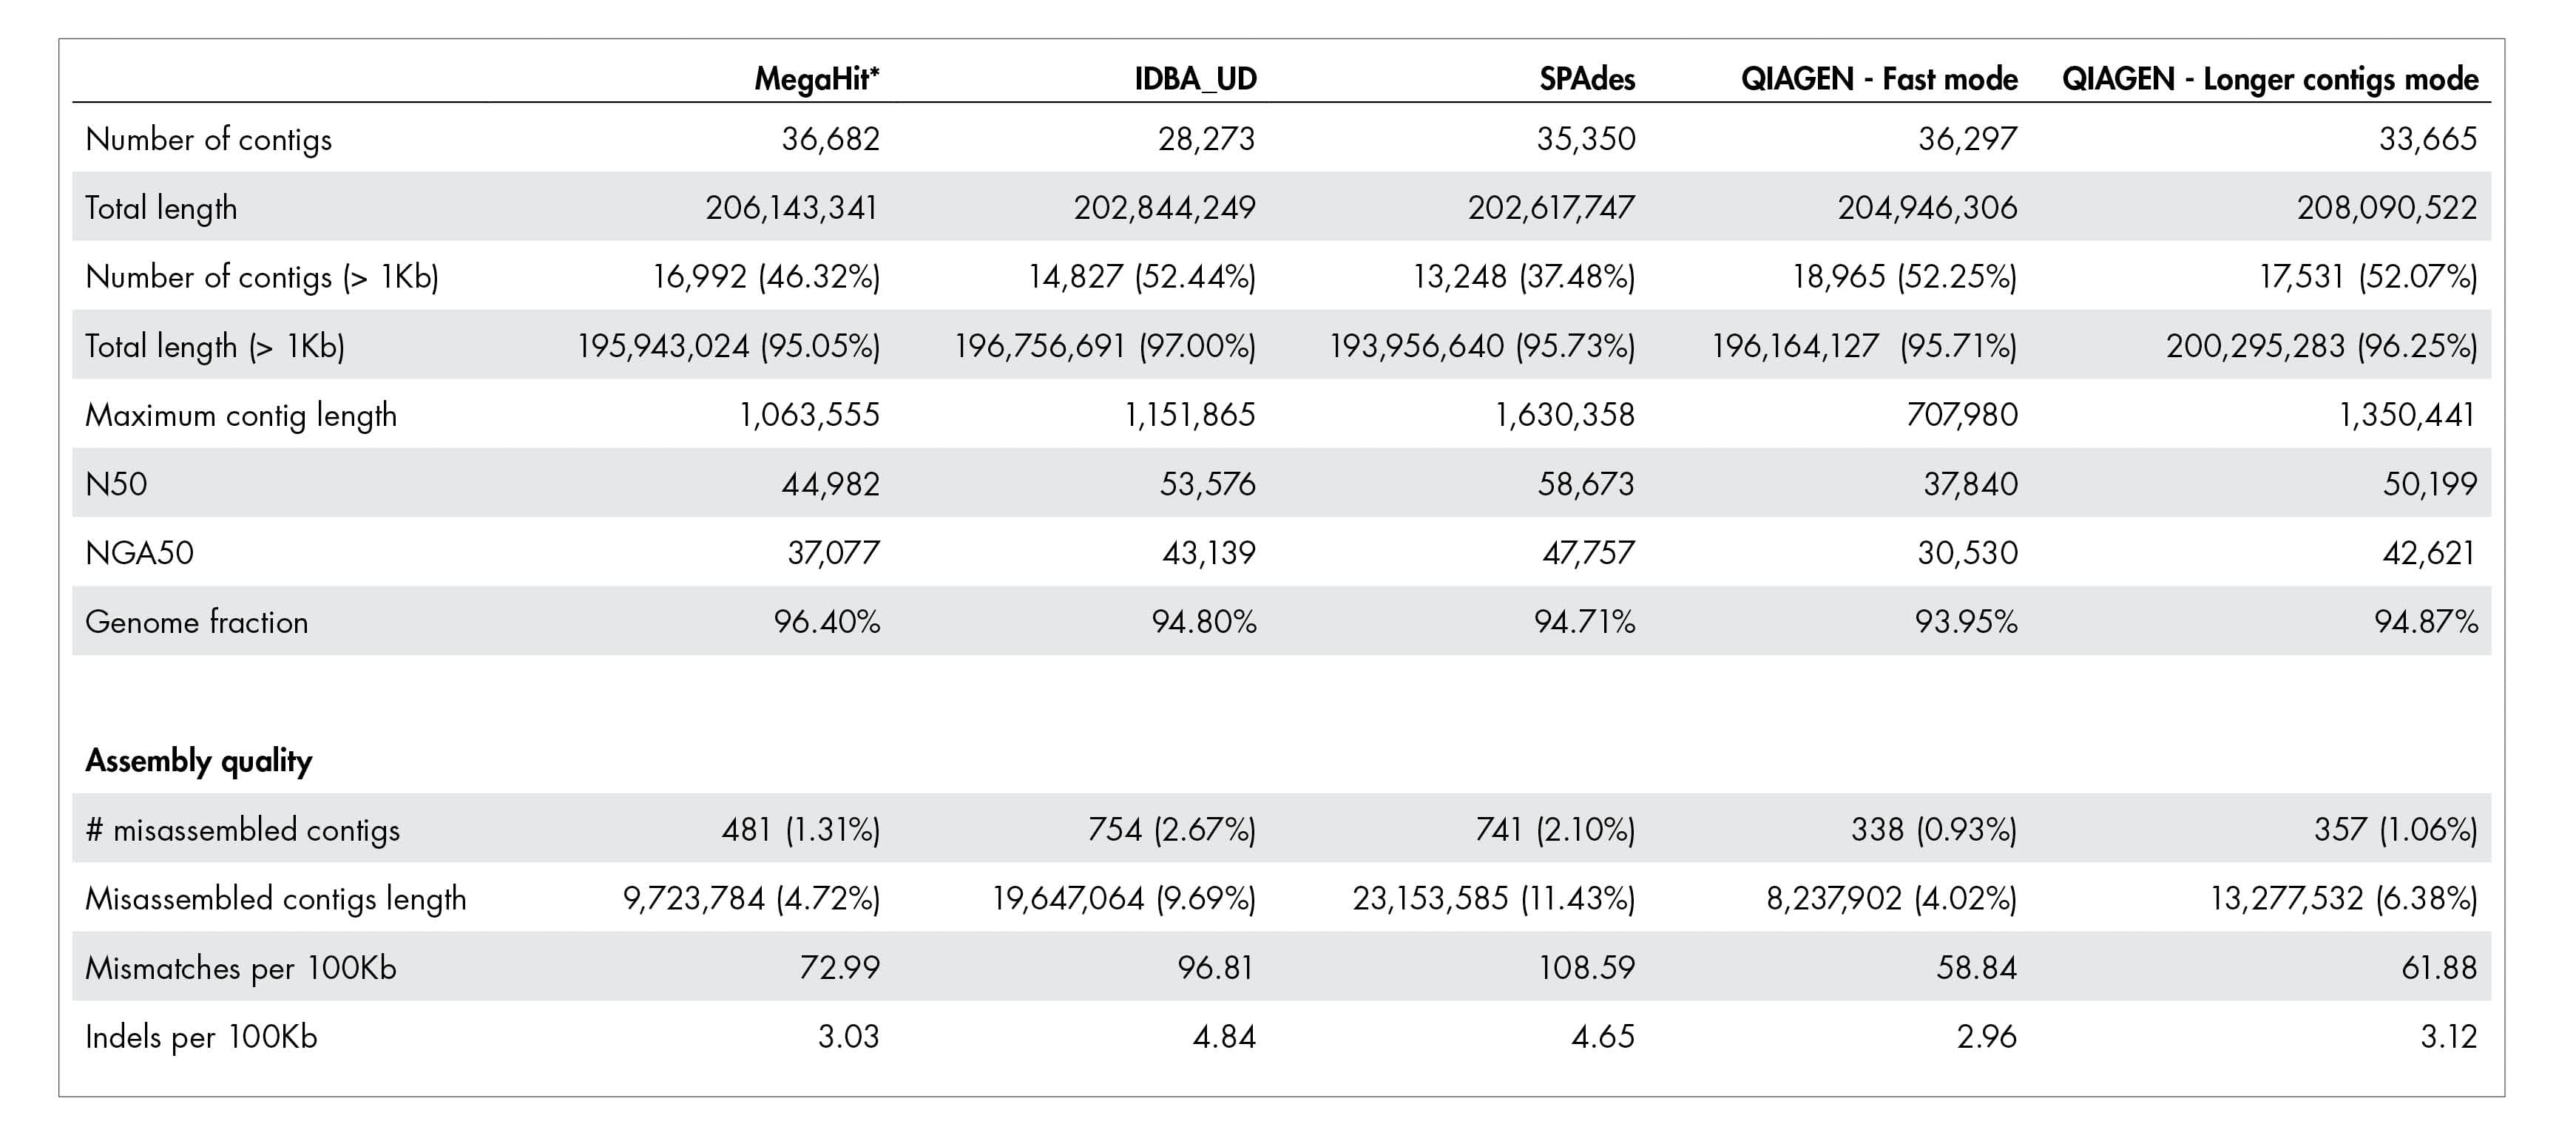
Table 1: Quality of metagenome assembly.
The QIAGEN metagenome assembler delivers superior assembly quality resulting in more accurate annotation of functional genetic content. A dataset published by Shakya et al. 2013 was used for this benchmark. The actual number for “Total length” and “Total length (>1kb)” should be close to 209,845,413 bases.
Run time and compute resource requirements are important when sample volume is high.
We have benchmarked the metagenome assembler included in our microbial genomics solution against leading metagenome assemblers using a dataset by Shakya et al. 2013. Shorter run time and greater compute resource efficiency was consistently demonstrated compared to other leading assemblers.
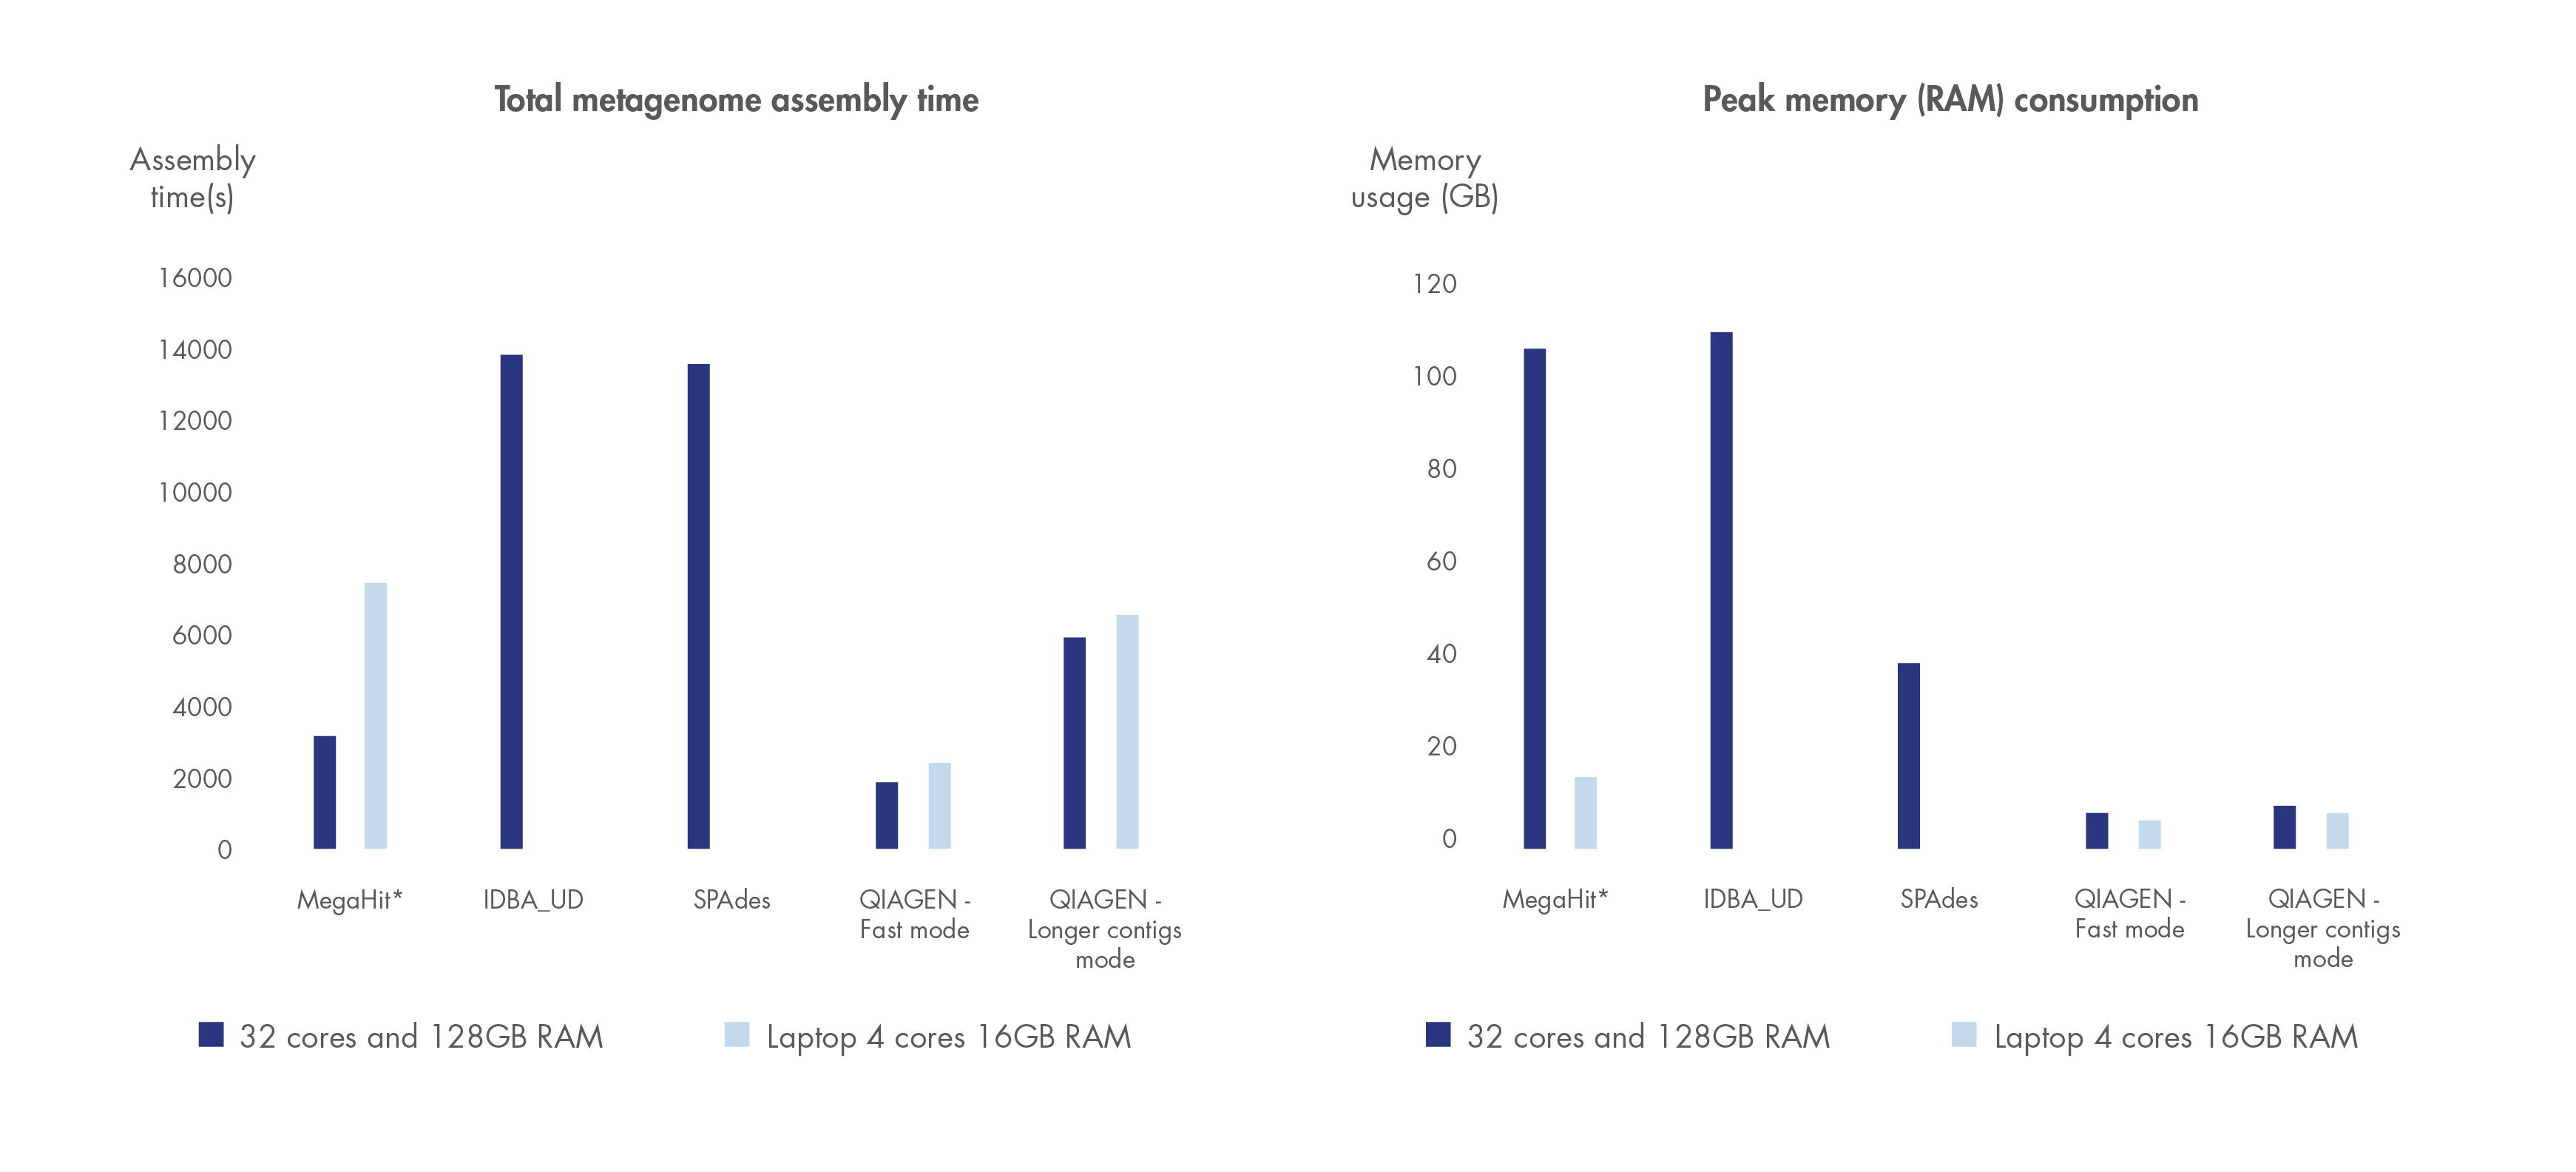
Figure 3. Best in class metagenome assembly.
Accelerated algorithms result in metagenome assembly that outcompetes leading alternatives in run time and compute resource consumption. *Note that MegaHit is able to scale its memory consumption down by sacrificing run time.
Increase walk away time
To increase walk away time, users can use the Workflow feature in CLC Genomics Workbench to combine the analysis steps 2 through 7 listed below into a preconfigured one-click workflow. Workflows are capable of batch processing many samples increasing walk-away time.
Analysis steps in functional metagenomics workflow:
1 → Import of multiple whole metagenome sample read datasets and association of metadata to each sample.
2 → QC and trimming of whole metagenome reads.
3 → De novo assembly of each sample read dataset into high-quality contigs using the new De Novo Assemble Metagenome tool.
4 → Locate coding sequences (CDS) in the resulting contigs using the third-party MetaGeneMark genefinder plugin for the CLC workbenches.
5 → Annotate CDSs with Gene Ontology (GO) terms and Pfam protein families or Best BLAST Hits using one of the two new tools, Annotate CDS with Pfam or Annotate CDS with Best BLAST Hit, respectively.
6 → Map the input reads back to the annotated contigs using the built-in Map Reads to Reference tool in the CLC workbenches.
7 → Build a functional abundance profile of each sample using the Build Functional Profile tool
8 → Merge the functional abundance profiles for all samples into one profile using the Merge Functional Profile tool.
9 → Visualize the individual and merged functional abundance profiles, perform filtering based on abundance, and apply the different options for showing the abundance profiles in the context of metadata.
10→ Perform hierarchical clustering and statistical analysis based on the relative abundance of functional elements in the samples.
Find out more about our microbial genomics solution