


RNA sequencing technologies can generate datasets with thousands of differentially spliced transcripts. IsoProfiler helps you determine which isoforms have interesting biological properties relevant to your research project.
Identify isoforms with significant pattern(s) of expression, such as:
Prioritize the most significant isoforms by:
Focus on important attributes of the isoforms:
Visualize isoform-level expression in one dataset or across multiple datasets:
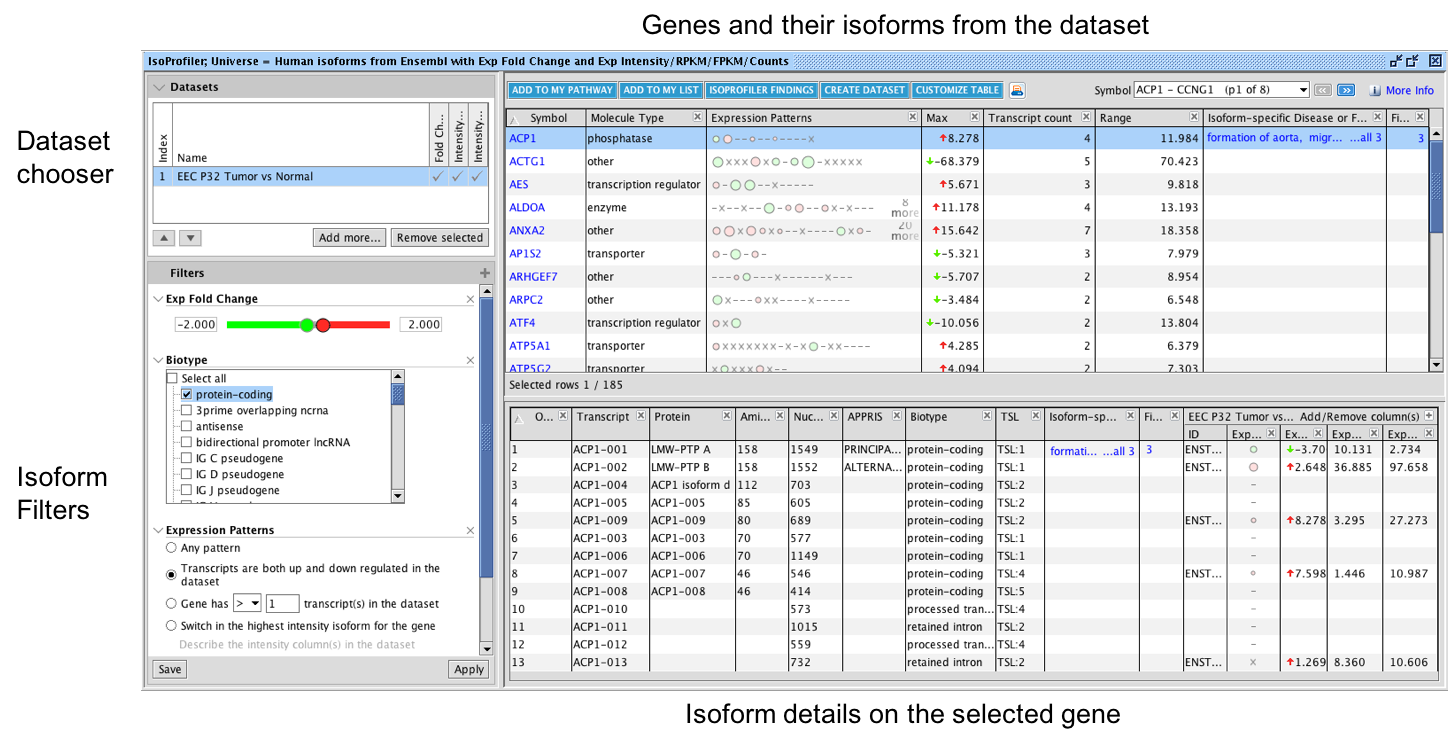
Fig 1. Overview of IsoProfiler. Visualize one or more transcript-level RNA sequencing datasets; filter and sort to focus on isoforms that have biologically relevant attributes. The top table shows each gene and their associated transcripts while the bottom table shows isoform-level details for one gene at a time (based on the row you select in the top table). Click on the plus (+) sign in the left filter panel to display filter options that can be added. In the example shown above, the dataset is filtered for isoforms with fold change less than -2 or greater than +2, and only shows genes where isoforms are both up and down regulated in the dataset. Transcripts are represented as circles in the Expression Patterns column in the top table, with green circles indicating down regulation and pink or red circles corresponding to upregulated transcripts. The size of the circles represents the abundance of expression (for example RPKM) if you have included at least one such column in your dataset—larger circles have higher abundance transcripts.
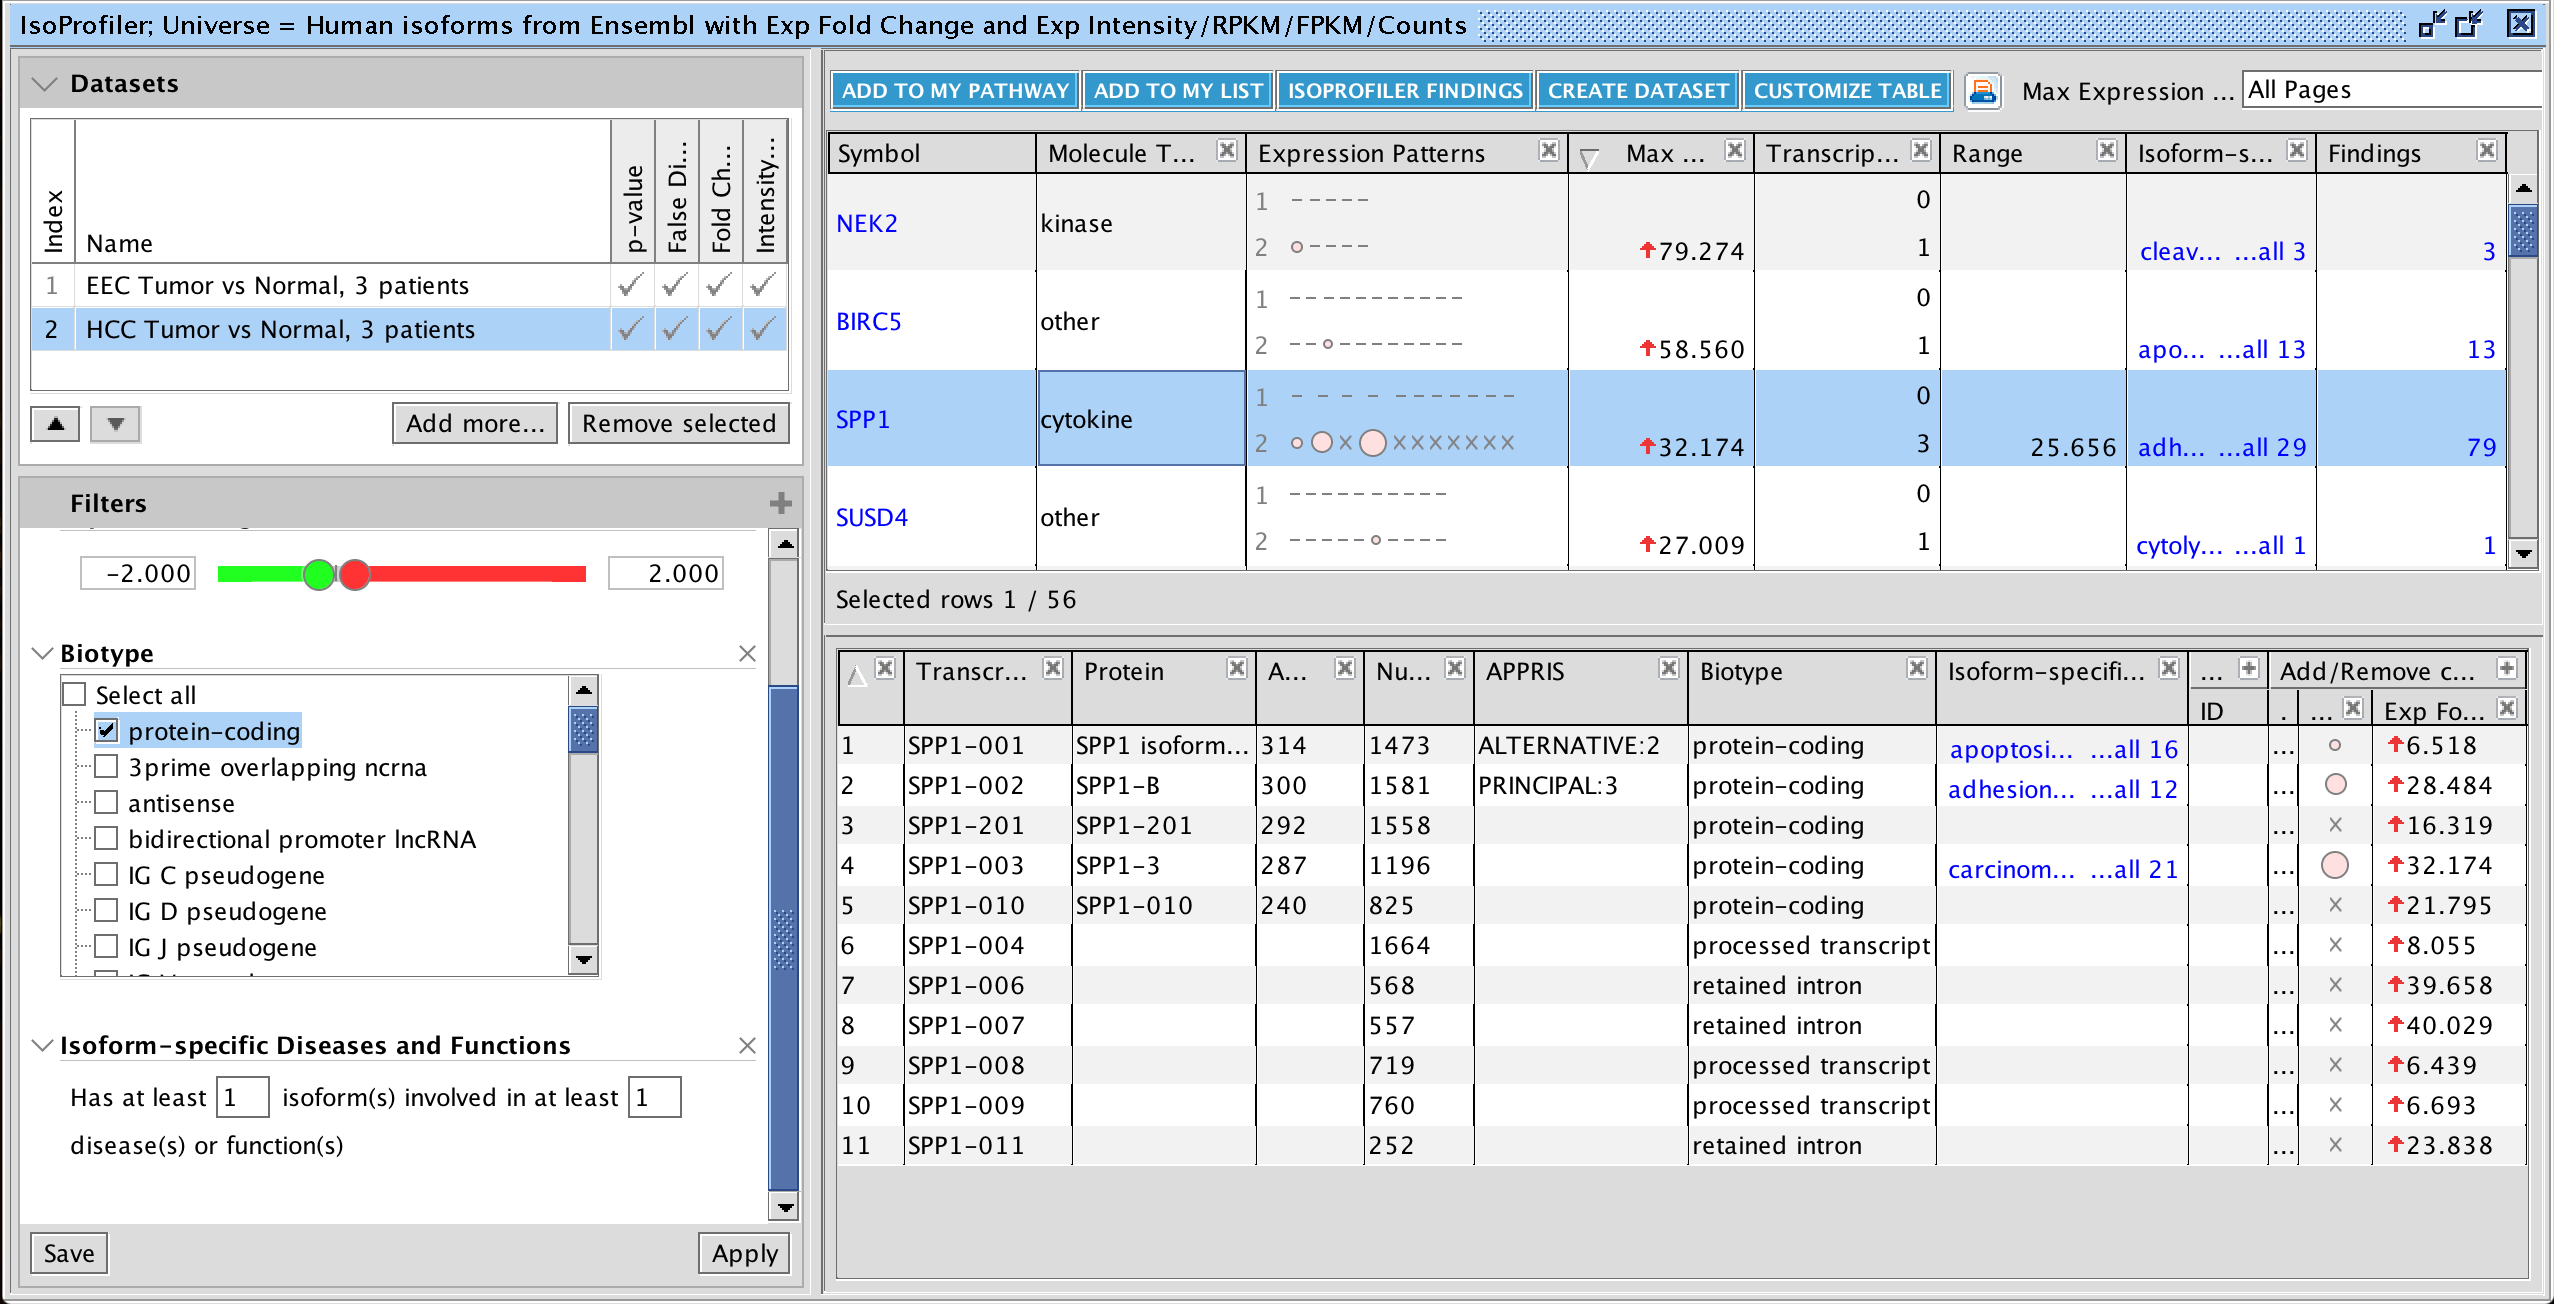
Fig 2. Compare up to 20 transcript-level datasets in IsoProfiler. In this example, human endometrioid endometrial carcinoma (EEC) and hepatocellular carcinoma (HCC) RNA-seq datasets are compared. The results are shown after using IsoProfiler to set expression value cutoffs, filter for protein-coding isoforms, and keeping only those genes with isoforms in the dataset that have known disease and function associations.
Drill-down into the “IsoProfiler Findings” view to explore the details about the isoforms that have disease or biological function findings captured from the literature. This is done by selecting rows (or all rows) in the top table and clicking the IsoProfiler Findings button at the top of the table. This will open a special window as shown in Figure 3. Only isoforms with disease or function associations will appear in this window. This table enables filtering on findings-level details using the funnels, or filters, above each column.
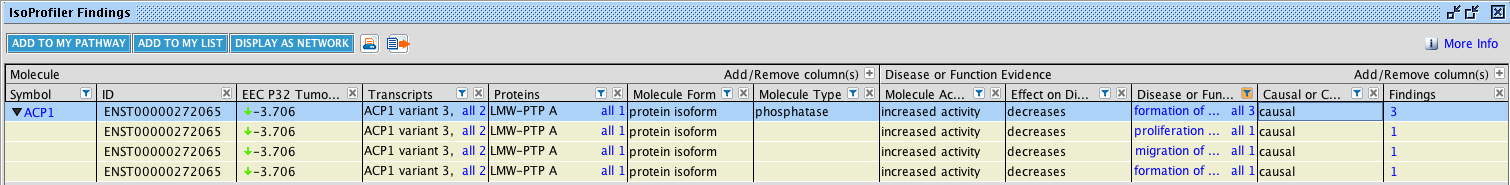
Fig 3. Explore the details of isoform-level disease and function associations. Filter and explore the findings that connect isoforms to disease and functions.
IsoProfiler is part of Advanced Analytics.