


Latest improvements for QIAGEN OmicSoft Lands
QIAGEN OmicSoft Lands
Release date: 2023-10-20
OmicSoft Lands Release 2023R4
Highlights
- Several updates for proteomics data, including data from The Cancer Genome Atlas (TCGA), the Human Protein Atlas (HPA) and the Clinical Proteomic Tumor Analysis Consortium (CPTAC)
- Hundreds of new datasets with over 1000 new statistical comparisons revealing differentially expressed genes and proteins
- 215 new samples added to ATCC Cell Line Land, bringing the total number of samples to 1353
General updates
Land Database Version Cleanup
With our upcoming update to OmicSoft Lands, we will retire legacy versions of databases from hosted Lands servers. Customers with dedicated installations are recommended to review the list of available databases and remove any legacy versions that are not being used. In most cases, the recommended version is Human Genome version 38 and gene model GenCode.V33 (“B38_GC33 Lands”). This will reduce confusion for users who are unsure which database to use to search for relevant information.
Attend live and on-demand webinars
The expert Field Application Scientists of QIAGEN® routinely hold online trainings for new and advanced users of OmicSoft Lands data, showcasing the use of these resources to answer scientific questions. See upcoming webinars, as well as recordings of previous webinars here: https://digitalinsights.qiagen.com/webinars-and-events/
Update to the latest OmicSoft Suite version to access the latest features
OmicSoft Suite will soon roll out a new version that will significantly reduce the loading time and memory footprint of Single Cell Lands. Updates include new visualizations and features that cannot be accessed in earlier versions. Contact ts-bioinformatics@qiagen.com to learn more.
BodyMap updates
Human Protein Atlas

Figure 1. Samples available from the Human Protein Atlas Land with RNA-seq or TMA protein data, grouped by TissueCategory and colored by tissue.
The HPA project aims to map all human proteins in cells, tissues, and organs. A key focus of this effort is the use of both transcriptomics and tissue microarray (TMA) proteomics.
HPA data are now available for Human Genome version 38/OmicSoftGencode.V33, with 134 more samples that were not available in HPA_B37. This release includes 226 samples with complete transcriptomic profiles (transcript, gene, exon junction, exon, mutation, and fusion) processed using the OmicSoft RNA-seq pipeline and 280 samples with protein profiles from TMA assays.
Metadata curation improvements
Metadata definitions can be found as tooltips in OmicSoft Studio.
New metadata fields: SampleMaterial, TissueDescription, AgeSummary, CellStructure, LibraryKit, Molecule, Description, SampleProcessingLocation, SampleAlias, SampleDescription, and RIN
Renamed metadata fields:
| Old Field Name | New Field Name | ||
| Land Sample Type | OncoSampleType | ||
| Reference | CellLineReference | ||
| Sample Type | SampleType | ||
| ErxID | SrxID | ||
| EnaSample | SampleAccession |
Removed metadata fields (from HPA_B37): AssayName, EnaRun, ExtractName, FastqUri, MaterialType, NominalLength, Orientation, ProtocolRef, ReadIndex1BaseCoord, ScanName, SpotLength, TechnologyType, TermSourceRef, Land Tissue, Tumor Or Normal, Read Length, Coverage_GeneWith10RPKM, Coverage_GeneWith10RPKMRate, Coverage_GeneWith1RPKM, Coverage_GeneWith1RPKMRate, RNASeq Mapped Read Count, RNASeq Mapping Rate [Percent], CellOrigin, and Selected":2,"335551550":6,"335551620":6,"335559739":300,"335559740":300}">
Note: samples hpa_cerebellum_GLUC_cells_cytoplasm_membrane and hpa_cerebellum_GLUC_cells_nucleus refer to an unknown “GLUC” cell type, which could not be further identified. These samples are curated as “CellType: other cell” and “CellDescription: GLUC cell”.
OncoLand updates
ClinicalProteomicTumor
ClinicalProteomicTumor integrates studies focused on cancer proteomics from CPTAC and other repositories, including additional data such as transcriptomics and somatic variation.
This release adds 408 samples and 374 comparisons from 2 projects, focusing on lung adenocarcinoma (paired tumor-normal) and colon adenocarcinoma. These new studies include mass spectrometry (MS) proteomics, RNA-seq, and somatic mutation data profiling.

Figure 2. Correlation scatter plot of statistical comparisons of primary lung tumor vs paired normal lung samples in PDC000153, assessing RNA (X-axis) vs MS protein (Y-axis) fold change.
OncoHuman
OncoHuman is the unified repository of oncology transcriptomics projects from thousands of studies requested by OmicSoft users.

Figure 3. New samples in OncoHuman, grouped by DiseaseState and colored by TissueCategory.
This release adds 3285 samples and 819 comparisons from 88 datasets on the following topics:
- Urinary cancer (bladder): GSE125547, GSE145260, GSE147938, GSE149582, GSE169455, GSE130455, GSE135527, GSE136401, GSE151505, GSE156461, GSE163899, GSE176178, GSE179440, GSE183777, GSE186609, GSE186610, GSE198607, GSE199471, GSE77952, and GSE86411
- Urinary cancer (kidney): GSE133446, GSE146354, GSE150404, GSE153965, GSE180925, GSE98334, GSE133460, GSE138869, GSE151419, GSE151423, GSE165728, GSE171358, GSE180820, and GSE197047
- Colorectal cancer: GSE97023, GSE86557, GSE86559, GSE86562, GSE86563, and GSE86564
- β-cell acute lymphoblastic leukemia (β-ALL): GSE236141, GSE236138, GSE236138, GSE212312, GSE212312, GSE212209, GSE207057, and GSE206258
- T cell lymphoma (TCL): GSE126768, GSE50803, and GSE63122
- Cutaneous T cell lymphoma (CTCL): GSE157442, GSE162137, and GSE119345
- Diffuse large B cell lymphoma (DLBCL): GSE215900, GSE212746, GSE171763, GSE207388, and GSE182359
- Non-small cell lung cancer (NSCLC): GSE118370, GSE144945, GSE174330, GSE1987, and GSE211044
- Small cell lung cancer (SCLC): GSE126353, GSE142024, GSE144457, GSE151000, GSE151904, GSE155923, GSE159801, GSE205880, GSE210101, GSE210104, and GSE210110
- Lung adenocarcinoma (LUAD): GSE75037 and GSE94601
- Neuroblastoma: GSE148263 and GSE89413
- CRISPR knockout: GSE144972, GSE144972, GSE160393, GSE174256, GSE175787, GSE182487, GSE183592, GSE185318, GSE189552, GSE189553, GSE195675, GSE199538, and GSE210870
- Drug toxicity: GSE102006
Removed/reprocessed datasets or comparisons
No datasets were removed from this release.
As part of our standard review process, comparisons for the following already-landed projects were revised and can be found with an updated “OSModifiedDate”: GSE159472, GSE57611, GSE34171, GSE34171, GSE34171, GSE4475, GSE1299, GSE1299, GSE1299, GSE45419, GSE8096, GSE28448, GSE1133, GSE1822, GSE1825, GSE2067, and GSE229.
The Cancer Genome Atlas

Figure 4. New MS proteomics comparisons enable rapid biomarker discovery. (A) Hundreds of new statistical comparisons of MS proteomics data are available for BRCA, COAD, OV, and READ cancer types. (B) Differential protein expression analysis between HER2-positive and HER2-negative breast cancer proteomics samples reveal upregulation of ERBB2 (HER2), GRB7 (adjacent to ERBB2 in the genome), and MIEN1. (C) MIEN1 protein is significantly upregulated in many statistical comparisons, including in breast cancers. (D) Sample-level protein expression of MIEN1 is higher on average in HER2-positive breast cancer samples compared to HER2-negative samples.
The Cancer Genome Atlas (TCGA) is a landmark pan-cancer genomics program profiling thousands of tumors across 33 cancer types. QIAGEN OmicSoft enhanced the utility of these data with major curation and unification efforts. Learn more about the curation and available metadata dictionary here: https://digitalinsights.qiagen.com/news/blog/discovery/a-better-way-to-explore-tcga-data/
With this release, TCGA metadata are updated to the current formatting standards used in other OncoLands (project-level metadata, spaces removed from column names, reformatted AgeAtDiagnosis). New proteomics data and comparisons were added, and methylation array data uplifted from Human Genome version 37.
New data:
- MS proteomics data added for COAD and READ samples
- Statistical comparisons for BRCA, OV, COAD, and READ based on proteomics data
- Methylation array data uplifted from Human.B37 array data
New curated metadata fields:
- PairingStatus and PairingType fields added
- MutationStatus[EGFR] added for relevant samples
Additional metadata changes:
- SmokingStatus and surgery terms are now aligned to the OmicSoft CV
- Several fields formatted to the current OmicSoft standard, including MutationStatus[RET], PR[Staining][%][MetastaticBreastCarcinoma], PR[Staining][%], HER2[Staining][%][MetastaticBreastCarcinoma], HER2[Staining][%], ER[Staining][%][MetastaticBreastCarcinoma], ER[Staining][%], MIB1Positive[%], PRAD_Cell2015_TumorCellularity[%], and NecrosisContent[Total][%]
Known issues:
For some samples, the TCGA-reported immunohistochemistry (IHC) statuses for ER, HER2, and PR are not consistent with the reported staining intensity. Interpret these samples with caution.
| SubjectID | ER[Status][IHC] | ER[Staining][%] | ER[Status][IHC][Score] | ||
| TCGA-LL-A73Y | Negative | NA | 3 | ||
| TCGA-AC-A3W6 | Positive | 90–99 | 1 |
| SubjectID | HER2[Status][IHC] | HER2[Staining][%] | HER2[Status][IHC][Score] | ||
| TCGA-AO-A03M | Negative | 30–39 | 2 | ||
| TCGA-AC-A3W6 | Negative | NA | 3 |
| SubjectID | PR[Status][IHC] | PR[Staining][%] | PR[Status][IHC][Score] | ||
| TCGA-BH-A0DQ | Positive | 70–79 | 1 | ||
| TCGA-S3-AA12 | Negative | NA | 2 |
DiseaseLand updates
HumanDisease
HumanDisease is the unified repository of non-oncology disease omics projects from thousands of studies requested by OmicSoft users.

Figure 5. New samples in HumanDisease (excluding control samples), grouped by DiseaseState and colored by TissueCategory.
This release adds 2962 samples and 985 comparisons from 63 datasets, including studies on:
- Gene knockout/CRISPR/siRNA experiments: GSE102004, GSE103309, GSE104690, GSE110268, GSE114918, GSE115311, GSE115357, GSE115973, GSE116934, GSE120396, GSE120397, GSE122334, GSE124636, GSE128177, GSE130391, GSE134386, and GSE134662
- Graft-versus-host disease (GVHD) and transplant: GSE193309, GSE157959, GSE158834, GSE159853, GSE163568, GSE164425, GSE165025, GSE166024, GSE174020, GSE181741, GSE181804, GSE181813, GSE181981, GSE182173, GSE182223, GSE182440, GSE182610, GSE182612, GSE182649, and GSE182678
- Parkinson's disease (PD): GSE135998, GSE144127, GSE150686, GSE150735, GSE151190, GSE152939, GSE153657, GSE154577, and GSE157538
- Alcohol dependence: GSE193977, GSE208347, GSE218048, GSE222889, GSE223390, GSE225159, GSE74324, and GSE74991
Removed/reprocessed datasets or comparisons
The following samples were temporarily removed from GSE7307 GPL570 because the treatment term “SDF” is underspecified: GSM175963, GSM175964, GSM175965, GSM175971, GSM175972, and GSM175997.
No datasets were removed this release.
As part of our standard review process, comparisons for the following already-landed projects were revised and can be found with an updated “OSModifiedDate”: GSE102956, GSE102956, GSE117588, GSE13837, GSE56495, GSE54363, GSE13837, GSE46451, GSE74235, GSE95588, GSE49454, GSE65391, GSE97165, GSE175913, GSE179448, GSE6269, GSE6269, GSE41332, GSE102875, and GSE121137.
MouseDisease
MouseDisease is the unified repository comprising thousands of studies exploring mouse models of human disease, requested by OmicSoft users.

Figure 6. New samples in MouseDisease, grouped by DiseaseState and colored by TissueCategory.
This release adds 252 samples and 164 comparisons from 20 datasets, focusing on neurodegenerative disorders, autoimmunity and liver diseases: GSE111988, GSE113815, GSE120937, GSE122367, GSE124426, GSE125708, GSE128724, GSE135167, GSE138992, GSE141663, GSE148784, GSE157766, GSE158259, GSE161160, GSE163568, GSE174214, GSE179441, GSE180808, GSE185327, and GSE191131.
Removed/reprocessed datasets or comparisons
No datasets were removed for this release.
As part of our standard review process, comparisons for the following already-landed projects were revised and can be found with an updated “OSModifiedDate”: GSE52403, GSE106463, GPL17021, GSE113951, GPL19057, GSE109125, GSE104817, GSE58813, and GSE30431.
RatDisease
RatDisease is the unified repository comprising thousands of studies exploring rat models of human disease, requested by OmicSoft users.

Figure 7. New samples in RatDisease, grouped by DiseaseState and colored by TissueCategory.
This release adds 1189 samples and 602 comparisons from 18 datasets, focusing on compound profiling and toxicity: GSE172109, GSE124431, GSE10015, GSE10015, GSE113000, GSE132815, GSE34250, GSE47875, GSE49473, GSE53082, GSE63902, and GSE74676.
Removed/reprocessed datasets or comparisons
No datasets were removed for this release.
As part of our standard review process, comparisons for the following already-landed projects were revised and can be found with an updated “OSModifiedDate”: GSE194074.
ATCC Land updates
ATCC Human
This release adds 215 samples, bringing the total to 1353 samples from 315 unique cell lines.

Figure 8. Distribution of samples in ATCC_Human_B38_GC33, grouped by DiseaseCategory and colored by TissueCategory.
ATCC Mouse Summary
This release adds 84 new samples, bringing the total to 177 samples from 47 unique cell lines.

Figure 9. Distribution of samples in ATCC_Mouse_B38, grouped by DiseaseState and colored by TissueCategory.
Highlighted ATCC topics
This release begins the addition of lung cell lines from the ATCC collection.

Figure 10. Distribution of lung samples in ATCC_Human_B38_GC33, grouped by DiseaseState and colored by CellLine.
Combine the ability to search for QIAGEN Signaling Pathways with ATCC Cell Line Lands to identify cell lines exhibiting similar expression profiles within a pathway of interest.

Figure 11. Subset of a heatmap of the QIAGEN Sonic Hedgehog Signaling Pathway gene expression from respiratory samples from ATCC_Human_B38_GC33. Hierarchical clustering enables the grouping of samples with similar gene expression profiles.
OmicSoft Lands Release 2023R3
Highlights
- New datasets in HumanDisease, MouseDisease, and OncoHuman
- OncoHuman now includes recurated versions of all datasets previously found in ClinicalOutcome_B37
- New cell line profiles and comparisons in ATCC Cell Line Lands
Get the most out of your OmicSoft data subscription
Request new data curation
The OmicSoft team invites requests for new OncoLand and DiseaseLand expression projects to curate for upcoming releases. These will be included as part of your subscription.
Let us know which important datasets you would like curated and represented in the Lands. Public expression studies for human, mouse, and rat (GEO, SRA, or Array Express) will be evaluated. Single-cell transcriptomic projects, projects for bulk RNA-seq, and commercial expression arrays from Affymetrix®, Illumina®, and Agilent® are compatible platforms, as well as Mass Spectrometry proteomics datasets. Please email omicsoft.support@qiagen.com for more information.
Use the latest Land database versions
We recommend using the latest version (“B38_GC33”) when available, as this is where you will find the newest and most comprehensively curated data. This video demonstrates how to add new Land databases to your dedicated server.
Updated B38_GC33 Land databases include:
- Oncology Projects — OncoHuman (including legacy ClinicalOutcome, Pediatrics, Hematology, and Metastatic Cancer databases) and ClinicalProteomicTumor
- Oncology Consortia – BeatAML, CGCI, expO, METABRIC, TARGET, TCGA, TRACERx
- Non-Oncology Projects – HumanDisease
- Normal Tissue profiling – GTEx, Blueprint
- Cell Line profiling – ATCC, CCLE, CellLine (GSK, NCI, Pfizer)
- Single cell Lands (UMI and non-UMI)
Download flat files of full Land databases
If your subscription includes access to OmicSoft Land “text dump” flat file exports, you can request the latest data in the form of a series of indexed tab-delimited tables, or through the MyQDI web interface (my.qiagendigitalinsights.com).
These files are perfect for larger exploratory meta-analysis and ML studies.
If you are interested in access to the latest data via flat file, ask your OmicSoft account administrator to request the links, by contacting ts-bioinformatics@qiagen.com.
Attend live and on-demand webinars
QIAGEN®'s expert Field Application Scientists routinely hold online trainings for beginning and advanced users of OmicSoft Lands data, showcasing how to utilize these resources to answer scientific questions. See the upcoming webinars, as well as recordings of previous webinars, here: https://digitalinsights.qiagen.com/webinars-and-events/
Update to the latest OmicSoft Suite version for latest features
Methylation data in Land databases such as the new Clinical Proteomic Tumor Land are supported starting with OmicSoft Suite v12.5. To take advantage of these new data, please update your OmicSoft Suite environment to v12.5+. The upcoming release of TCGA will include Methylation array data, which will also require v12.5+.
OncoHuman: Curated oncology-focused omics studies
This release adds 5619 samples and 581 comparisons from 45 datasets on the following topics:
Highlighted studies and topics:
- Urinary cancer: GSE146870, GSE105402, GSE109029, GSE121237, and GSE122306
- Stomach cancer: GSE116782, GSE126304, GSE141352, GSE147163, GSE162214, GSE184336, GSE190449, GSE191275, GSE198136, GSE26253, GSE26899, GSE26901, GSE29272, GSE37023, GSE37023, GSE85465, GSE110237, and GSE13861
- Lung cancer: GSE159857, GSE181043, GSE226069, GSE79209, GSE111907, GSE84007, and GSE116946
- Breast cancer: GSE111914, GSE98987, and GSE130163
- Acute lymphoblastic leukemia: GSE168593 and GSE155597
- Multiple myeloma: GSE124435 and GSE124436
- Acute myeloid leukemia: GSE169428
- Other new datasets: GSE108277, GSE130625, GSE131837, GSE141801, GSE159000, GSE173263, and GSE38073

Figure 1. New samples in OncoHuman, grouped by DiseaseState and colored by OncoSampleType.
Study Highlight: Blood platelet profiling across tumors (GSE183635)
This large study profiles 2351 blood platelet samples, including 1628 patients with stage I-IV cancer from 18 different tumor types, 390 asymptomatic controls, and 333 symptomatic controls. This dataset highlights the ability of TEP (tumor-educated platelet) RNA-based “liquid biopsy” diagnostics for the detection and localization of early- and late-stage cancers.

Figure 2. Expression (transcripts per million) of WFDC1 in platelets from 18 tumor types and control patients, grouped by DiseaseState.
Removed/reprocessed datasets or comparisons
The following datasets were removed from OncoHuman_B38_CG33:
- GSE34211 (included in CellLine_B38_GC33)
As part of our standard review process, comparisons for the following projects were revised and can be found by an updated “OSModifiedDate”:
GSE6241, GSE126426, GSE20484, GSE18673, GSE16200, GSE4917, GSE29327, GSE37009, GSE43730, GSE63452, GSE4754, GSE54264, GSE54265, GSE54266, GSE54268, GSE56623, GSE110113, GSE43677, GSE14754, GSE72213, GSE3920, GSE2639, GSE14801, GSE6241, GSE9677, GSE126426, GSE84756, GSE29159, GSE6907, GSE4731, GSE5230, GSE2067, GSE6465, GSE101432, GSE123250, GSE163950, GSE82110, GSE53118, GSE12287, and GSE57611.
ClinicalOutcome integration into OncoHuman
This release of OncoHuman integrates 9719 samples and 646 comparisons from 64 datasets previously found in ClinicalOutcome_B37. Each dataset from ClinicalOutcome includes at least one survival metric for subjects.

Figure 3. Overall Survival data across from datasets integrated from ClinicalOutcome.
Datasets integrated from ClinicalOutcome include GSE10358, GSE10783, GSE10846, GSE10927, GSE11877, GSE12428, GSE12945, GSE13041, GSE13507, GSE1427, GSE1456, GSE14764, GSE14814, GSE16011, GSE16091, GSE16131, GSE16446, GSE16581, GSE17536, GSE17537, GSE17618, GSE18373, GSE18520, GSE19234, GSE19783, GSE19829, GSE1993, GSE22154, GSE22762, GSE2379, GSE24080, GSE24450, GSE26712, GSE29013, GSE30219, GSE31056, GSE31210, GSE31245, GSE3141, GSE3143, GSE3149, GSE31547, GSE32062, GSE3292, GSE34171, GSE3494, GSE37745, GSE42127, GSE42568, GSE4271, GSE4412, GSE4475, GSE4573, GSE5287, GSE6253, GSE6477, GSE7390, GSE7696, GSE8167, GSE8894, GSE9782, and GSE9890.
HumanDisease – Curated non-oncology disease studies
This release adds 6601 samples and 763 comparisons from 76 datasets, including studies on:
- Pulmonary hypertension: GSE113439, GSE117261, GSE121825, GSE133749, GSE135312, GSE138991, GSE146774, GSE156225, GSE156233, GSE157231, GSE168905, GSE174304, GSE207101, GSE212816, and GSE38528
- Dermatitis: GSE130588
- Hypertension: GSE202682
- COVID-19: GSE193022 and GSE179448
- Gestational diabetes: GSE216275, GSE216275, and GSE216997
- Nephropathy: GSE108112, GSE108109, and GSE141295
- Liver disease: GSE206364, GSE159676
- Premature ovarian insufficiency: GSE215358
- Menopause: GSE194086, GSE182338, GSE152112, GSE135583, GSE56814, GSE16907, and GSE16907
- Eye disease, retinal degeneration, retina profiling: GSE164208, GSE165322, GSE179260, GSE179603, GSE192881, GSE199548, GSE205370, GSE206529, GSE212914, GSE217746, GSE221860, and GSE221861
- Systemic lupus erythematosus: GSE211230, GSE209755, GSE177029, GSE175913, GSE175424, GSE173876, GSE168527, GSE184989, GSE185047, GSE187381, GSE192536, and GSE133317
- T-cells: GSE173635, GSE174860, and GSE178634
- Other datasets: GSE110008, GSE111351, GSE150707, GSE164400, GSE165004, GSE190615, GSE192665, GSE212640, GSE215841, GSE218039, GSE224362, GSE29161, GSE68501, and GSE89957

Figure 4. New samples in HumanDisease (excluding control samples), grouped by DiseaseCategory and colored by TissueCategory.
Study Highlight: Mount Sinai Crohn’s and Colitis Registry (GSE193677)
This large cross-sectional cohort of biopsied normal and IBD patients of both Crohn’s Disease and Ulcerative Colitis.

Figure 5. Expression of CHI3L1 in biopsied intestine tissues in both inflamed and non-inflamed ulcerative colitis and Crohn’s Disease patients, and normal control.
Samples are profiled on the Y-axis by DiseaseState and SamplePathology, and colored by detailed intestinal Tissue.
Removed/reprocessed datasets or comparisons
As part of our standard review process, comparisons for the following already-landed projects were revised and can be found by an updated “OSModifiedDate”:
GSE66890, GSE50614, GSE32407, GSE57225, GSE84779, GSE5057, GSE13736, GSE7138, GSE57893, GSE30447, GSE32443, GSE7307, GSE12161, GSE109140, GSE54937, GSE97469, GSE154936, GSE54254, GSE109824, GSE71862, GSE64536, and GSE17941
MouseDisease – curated mouse models of human disease
This release adds 834 samples and 420 comparisons from 38 datasets, including studies on:
- Lupus: GSE169486, GSE217939, GSE199662, GSE199496, GSE196316, GSE173875, GSE173767, GSE167108, GSE181816, GSE183827, GSE131892, GSE131893, and GSE200485
- Hypertension: GSE205031, GSE205267, GSE206779, GSE207256, and GSE207324
- Centronuclear myopathy: GSE210642, GSE207447, GSE160077, GSE160078, and GSE160079
- Menopause: GSE163849, GSE158946, GSE68303, GSE68302, and GSE194075
- Premature ovarian insufficiency: GSE196454 and GSE215358
- Female and male gonads: GSE55180 and GSE143218
- Other datasets: ERP116943, GSE160081, GSE160083, GSE193272, GSE193685, GSE206806, and GSE37646

Figure 6. New samples in MouseDisease (excluding control samples), grouped by DiseaseState and colored by TissueCategory.
Removed/reprocessed datasets or comparisons
As part of our standard review process, comparisons for the following already-landed projects were revised and can be found by an updated “OSModifiedDate”:
GSE115499, GSE207447, GSE114913, GSE119789, GSE15457, GSE21841, GSE87369, GSE104817, GSE54154, and GSE58813
ATCC Cell Line Land – Authenticated cell line profiling
ATCC Human Cell Line updates
This release adds 318 samples to bring the total number of samples to 1138, from 285 unique cell lines.

Figure 7. Distribution of samples in ATCC_Human grouped by Disease Category and colored by Tissue Category.
Cell Line Land: Minor update
This release adds 93 samples from 30 unique cell lines.

Figure 8. Distribution of samples in ATCC_Mouse grouped by Disease State and colored by Tissue Category.
ATCC Data highlight
This release includes all ATCC human and mouse hematologic cell lines.

Figure 9. Distribution of hematologic samples in ATCC_Human_B38_GC33, grouped by DiseaseState and colored by CellType.
Did you know?
ATCC_Human_B38_GC33 includes precomputed statistical comparisons between cell lines. Use this information to find cell lines expressing high levels of your gene of interest or to dive deep into biological differences with IPA.

Figure 10. Bubble plot of SCOC2 expression in ATCC_Human_B38_GC33, grouped by DiseaseState and colored by SampleSource. Each bubble represents an individual pairwise comparison, X-axis is the fold change of SOCS2, size of the bubble is the P value.
Changes to data availability and curation rules
“graft-vs-host disease (GVHD)” DiseaseCategory term has been changed to “Graft and transplant dysfunction” to better describe that this category encompasses all types of transplant complications and disorders.
Legacy methylation array datasets previously in HumanDisease, OncoHuman, etc., are currently backlogged. We will update individual datasets from individual studies based on customer requests.
ICGC data were removed to comply with updated license requirements. We are working to establish a new agreement that will allow access to these datasets. Please note that many datasets associated with ICGC are found in TCGA or other databases.
OmicSoft Lands Release 2023R2
Highlights
- New cancer proteomics-focused database “ClinicalProteomicTumor”
- OncoHuman now includes all legacy Hematology_B37 and MetastaticCancer_B37 datasets
- New datasets in Human, Mouse, and Rat Disease databases, including new cellular differentiation profiling datasets
Get the most out of your OmicSoft data subscription
Request new data curation
The OmicSoft team invites requests for new OncoLand and DiseaseLand expression projects to curate for upcoming releases. These will be included as part of your subscription.
Let us know which important datasets you would like curated and represented in the Lands. Public expression studies for human, mouse, and rat (GEO, SRA, or Array Express) will be evaluated. Single-cell transcriptomic projects, projects for bulk RNA-seq, and commercial expression arrays from Affymetrix®, Illumina®, and Agilent® are compatible platforms, as well as Mass Spectrometry proteomics datasets. Please email ts-bioinformatics@qiagen.com for more information.
Use the latest Land database versions
We recommend using the latest version (“B38_GC33”) when available, as this is where you will find the newest and most comprehensively curated data. This video demonstrates how to add new Land databases to your dedicated server.
B38_GC33 Land databases include:
- Oncology Projects — OncoHuman (including legacy Pediatrics, Hematology, and Metastatic Cancer databases) and ClinicalProteomicTumor
- Oncology Consortia – BeatAML, CGCI, expO, METABRIC, TARGET, TCGA, TRACERx
- Non-Oncology Projects – HumanDisease
- Normal Tissue profiling – GTEx, Blueprint
- Cell Line profiling – ATCC, CCLE, CellLine (GSK, NCI, Pfizer)
- Single cell Lands (UMI and non-UMI)
Use flat file downloads of Land databases
If your subscription includes access to OmicSoft Land “text dump” flat file exports, you can request the latest data in the form of a series of indexed tab-delimited tables, or through the MyQDI web interface https://my.qiagendigitalinsights.com.
These files are perfect for larger exploratory meta-analysis and ML studies.
Attend live and on-demand webinars
QIAGEN®'s expert Field Application Scientists routinely hold online trainings for beginning and advanced users of OmicSoft Lands data, showcasing how to utilize these resources to answer scientific questions. See the upcoming webinars, as well as recordings of previous webinars, here: https://digitalinsights.qiagen.com/webinars-and-events/
Update to the latest OmicSoft Suite version for latest features
Methylation data in Land databases such as the new Clinical Proteomic Tumor Land are supported starting with OmicSoft Suite v12.4. To take advantage of these new data, please update your OmicSoft Suite environment to v12.4+. An upcoming release of TCGA will include Methylation array data, which will also require v12.4+.
New Database – Clinical Proteomic Tumor Land
Starting with the 2023R2 release, QIAGEN OmicSoft is introducing a new Land database focused on cancer proteomics. The initial release includes three cancer proteomics projects from the Clinical Proteomic Tumor Analysis Consortium (CPTAC) database, with 509 samples, 254 statistical comparisons on both RNA-seq and protein expression, and hundreds of clinical metadata fields. Data types include Mass Spectrometry (MS), RNA-seq, miRNA-seq, DNA-seq mutation- and CNV profiling, and methylation data.
- “Integrated Proteogenomic Characterization of Clear Cell Renal Cell Carcinoma”
- PDC000127 (PMID 31675502)
- 194 samples with multi-omics measurements and 54 statistical comparisons at the RNA and protein level
- “Proteogenomic and metabolomic characterization of human glioblastoma”
- PDC000204 (PMID 33577785):
- 99 samples with multi-omics measurements and 116 statistical comparisons at the RNA and protein level
- “Proteogenomic characterization of pancreatic ductal adenocarcinoma”
- PDC000270 (PMID34534465):
- 216 samples with multi-omics measurements and 84 comparisons at the RNA and protein level
To aid exploration of these datasets, definitions for relevant metadata fields to these studies can be found in this ClinicalProteomicTumor Definitions File, as well as tooltips within Omicsoft Studio.
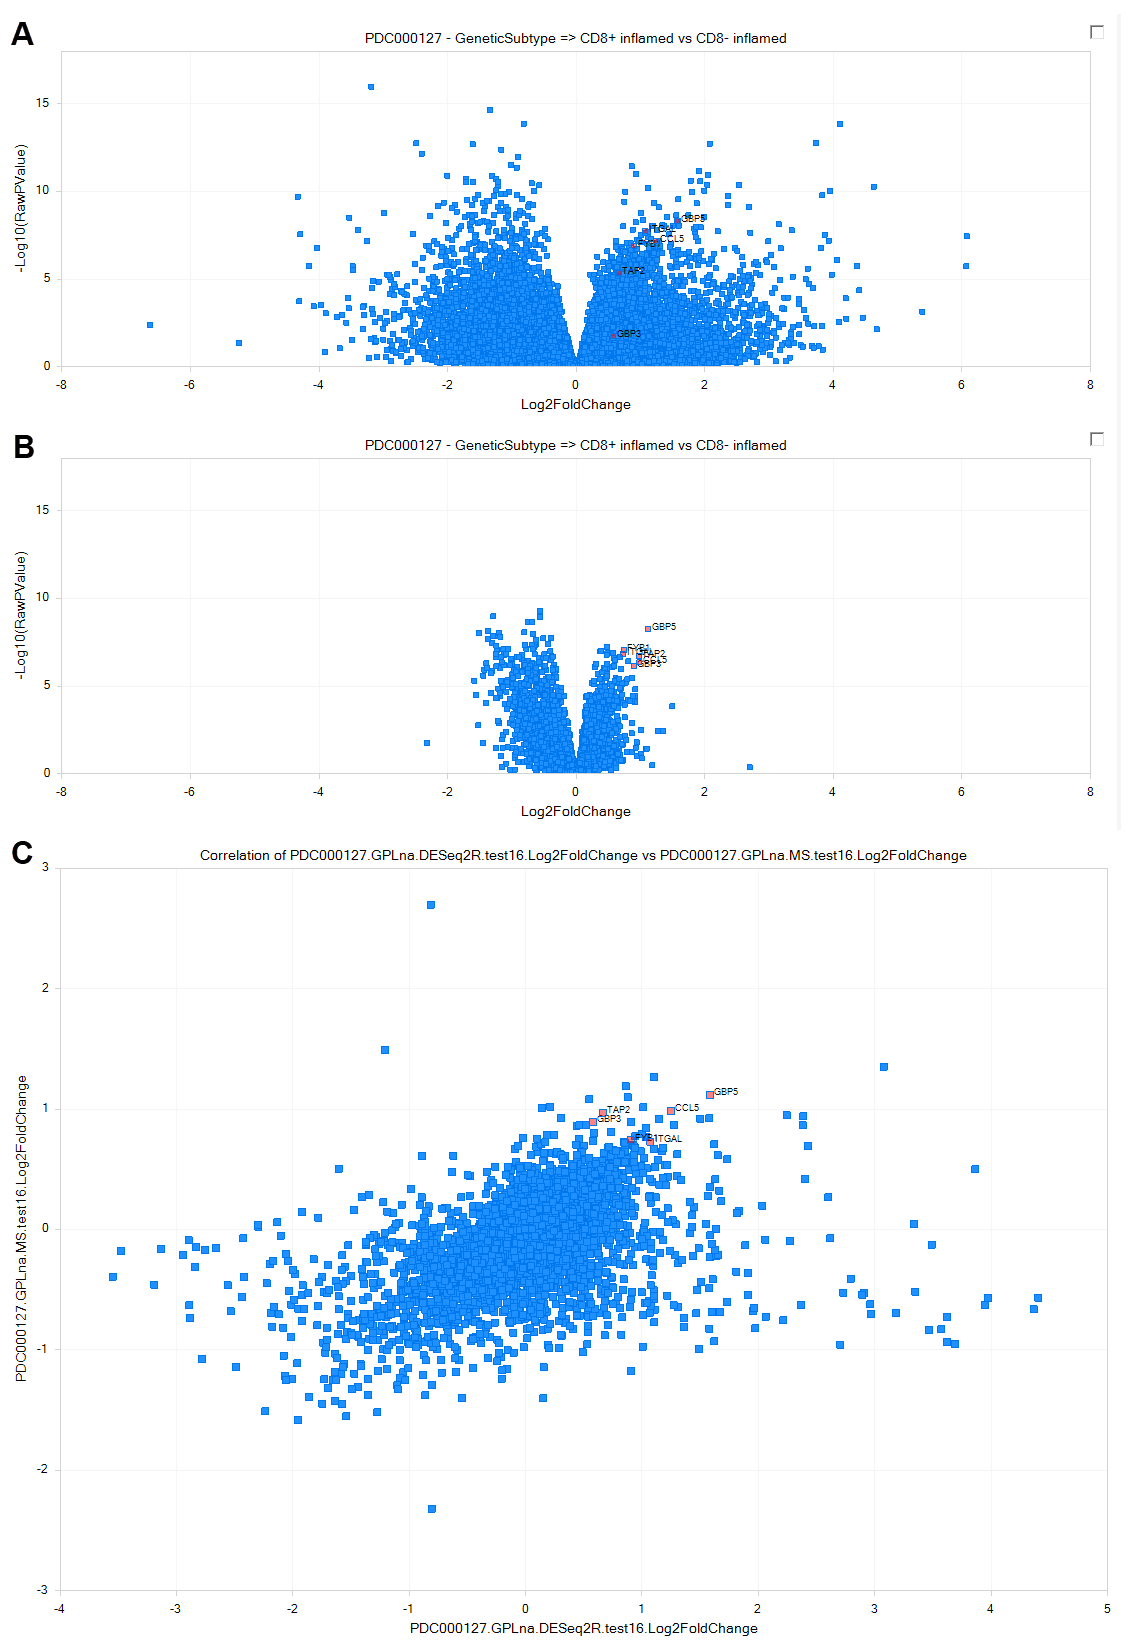
Figure 1. Correlation of statistical comparisons of CD8+ inflamed (interferon-γ signaling) vs CD8− inflamed (platelet degranulation) tumors in clear cell Renal Cell Carcinoma (ccRCC) from PDC000127, at the RNA and protein level. (A) Differentially regulated genes at the RNA level, calculated by DEseq2. (B) Differentially regulated genes at the protein level, calculated by general linear model. Top up-regulated proteins were selected to illustrate concordance with RNA-level up-regulation. (C) Comparison of direction and magnitude between RNA (X-axis) and protein (Y-axis) differential expression. Genes measured only at the RNA-level are plotted with a fold-change = 0 on the Y-axis.
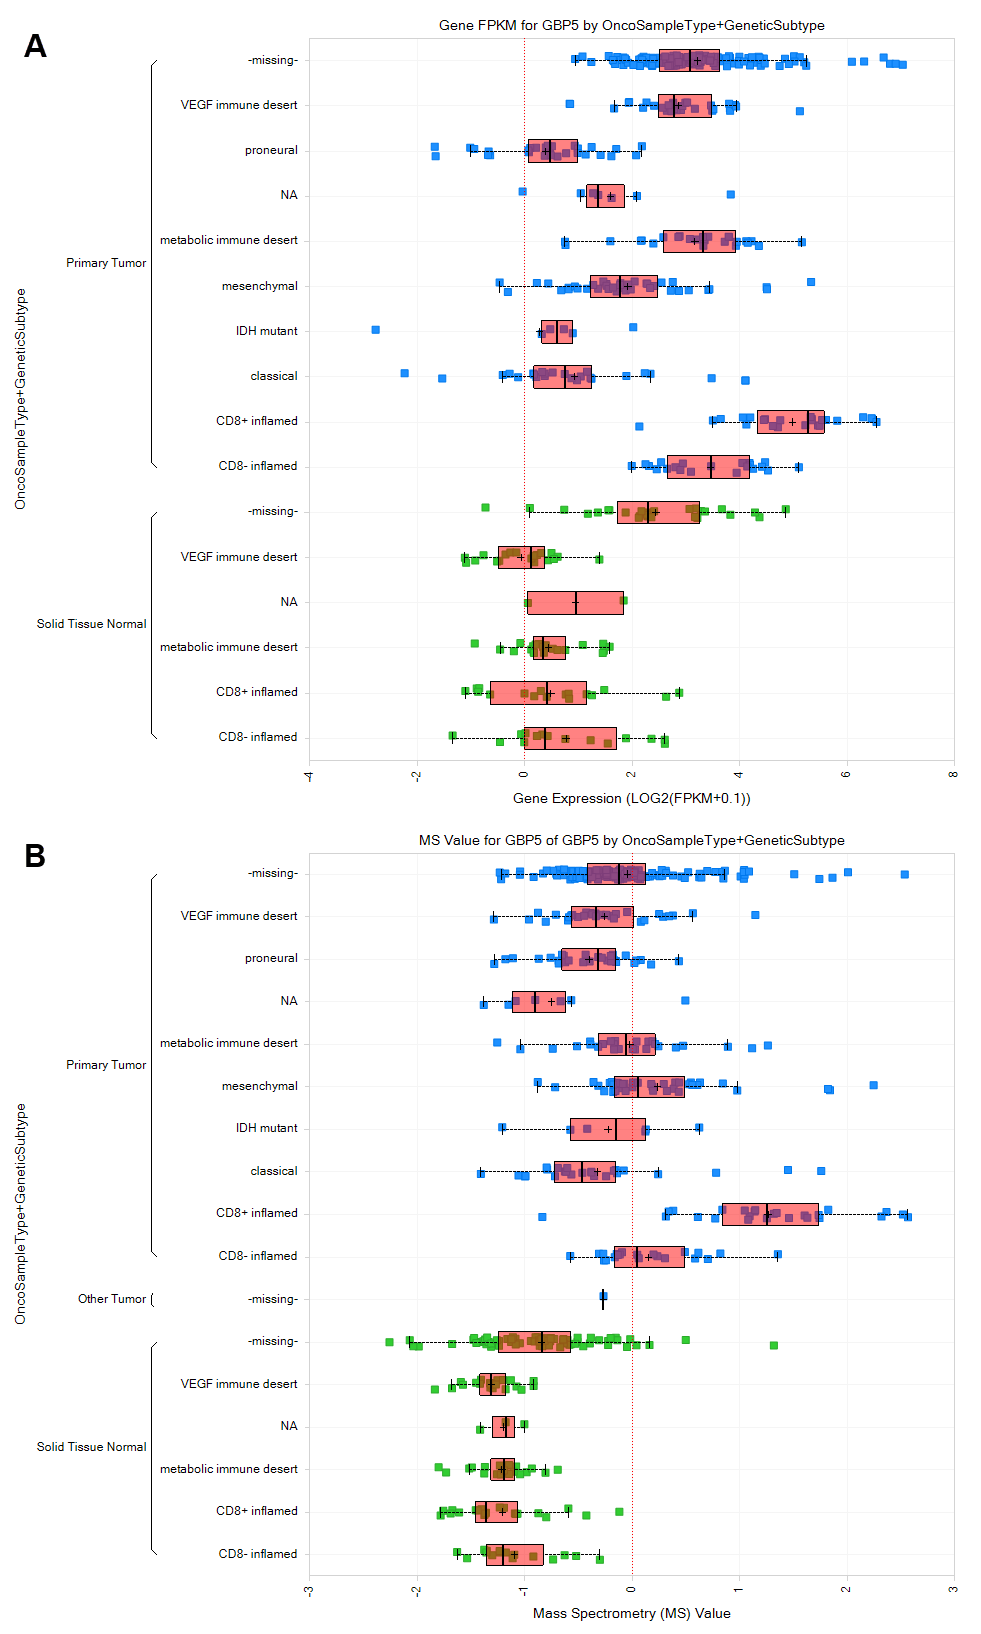
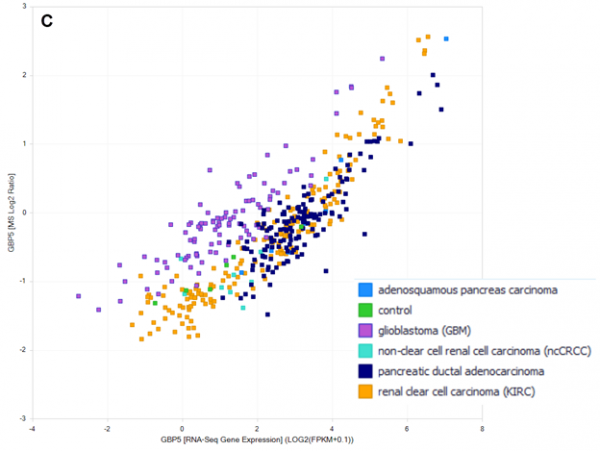
Figure 2. Expression of GBP2 at the RNA and protein level differentiates CD8+ vs other subtypes of ccRCC. (A) Expression of GBP2 at the RNA level, grouped by genetic subtype and OncoSampleType (Primary tumor vs Solid Tissue Normal). GBP2 is elevated across ccRCC tumor subtypes but is highest in CD8+ inflamed subtype. (B) Expression of GBP2 at the protein level, grouped by genetic subtype and OncoSampleType (Primary tumor vs Solid Tissue Normal). Similar to measurements of RNA, GBP2 protein is elevated across ccRCC tumor subtypes but is highest in CD8+ inflamed subtype. (C) correlation of RNA-seq (log2 FPM) and MS (log2 ratio) expression of GBP5 across pancreatic cancer, glioblastoma, and kidney cancer datasets.
OncoHuman: Curated oncology-focused omics studies
Figure 3. New samples in OncoHuman_B38_GC33, grouped by DiseaseState and colored by TissueCategory.
This release adds 3746 samples and 874 comparisons from 22 datasets on the following topics:
Highlighted studies and topics:
- Head and neck cancer: GSE67614
- Lung cancer: GSE175601 and GSE115002
- Breast cancer: GSE180284, GSE216333, and GSE180775
- Uterine cancer: GSE120490
- Esophageal cancer: GSE137867
- Liver cancer: GSE151412, GSE174570, GSE63898, and GSE183349
- Colorectal cancer: GSE222202, GSE207194, GSE147571, and GSE37892
- Prostate cancer: GSE193500 and GSE168718
- Melanoma: GSE157738
- Soft tissue sarcoma: GSE159847 and GSE159848
- Biomarkers of disease progression, prognosis, and response to treatment: GSE180775 (TNBC), GSE120490 (uterine), GSE147571 (colorectal), GSE175601, and GSE115002 (lung)
- Patient-derived xenograft experiments: GSE216333 (breast) and GSE193500 (prostate)
- Treatment studies: GSE180775, GSE207194, GSE137867, GSE151412, GSE67614 and GSE186341
- Large study (1726 samples) with RNA-seq profiles of cell-lines perturbed with 32 kinase inhibitors: GSE186341
In this release, a dataset of interest to many researchers (GSE186341) includes RNA-seq profiles of cell lines perturbed with 32 kinase inhibitors; this dataset served as the basis for a DREAM Challenge to assess computational algorithms for de novo drug polypharmacology predictions. In OncoHuman, profiles for 1728 samples and 703 statistical comparisons of kinase inhibitor responses are ready for exploration. Use these data to interrogate cell line specific responses to this set of kinase inhibitors.
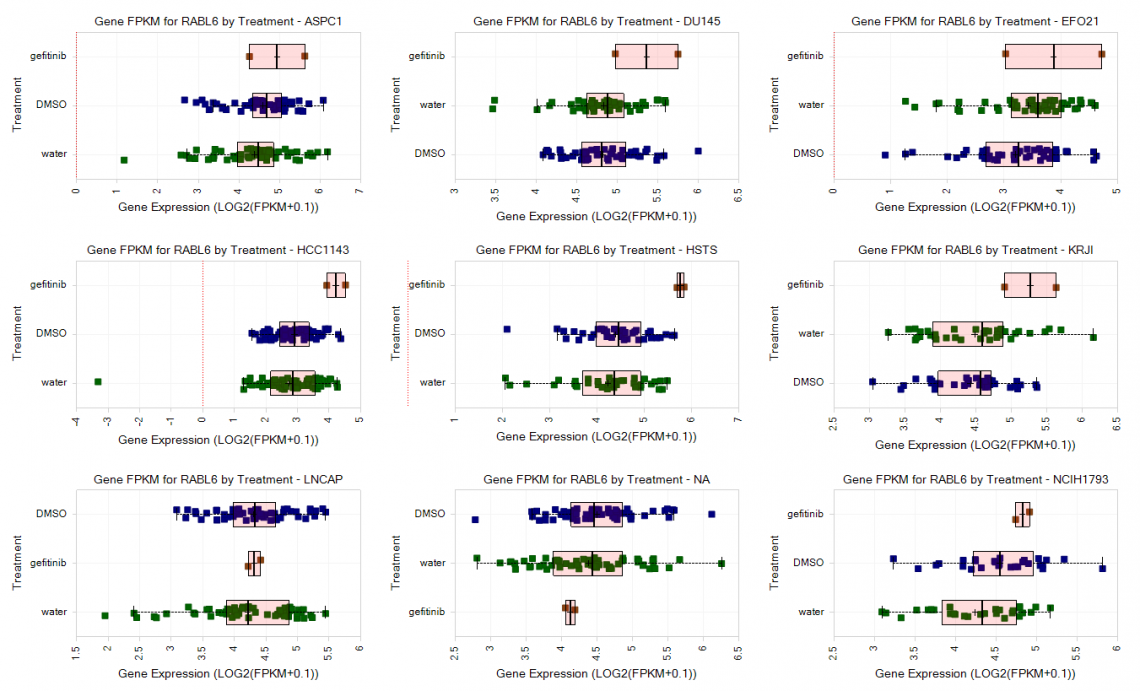
Figure 4. Gene expression of RABL6 24 hours after treatment with gefitinib in nine profiled cell lines from GSE186341.
Metastatic Cancer and Hematology legacy datasets integrated into OncoHuman
OncoHuman now has all compatible datasets previously found in Hematology_B37 (blood cancers) and MetastaticCancer_B37 (metastasis), meaning you can find nearly all curated oncology datasets in the OncoHuman database. All datasets uplifted from legacy databases have been reviewed and curated to meet the latest curation standards.
HumanDisease – Curated Non-cancer disease projects
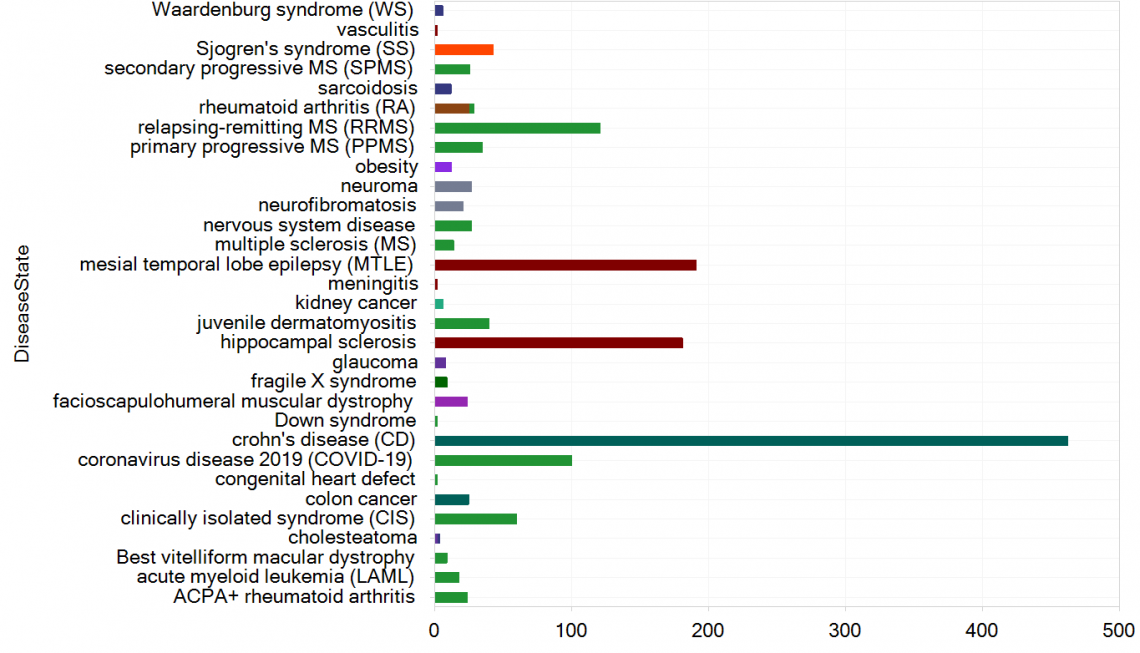
Figure 5. New samples in HumanDisease_B38_GC33, grouped by DiseaseState and colored by TissueCategory.
This release adds 2329 samples and 654 comparisons from 52 datasets, including studies on:
- CNS diseases (epilepsy, multiple sclerosis): GSE94744, GSE71058, GSE63808, and GSE196575
- Eye diseases (glaucoma, macular degeneration): GSE2378, GSE2378, GSE142591, GSE146641, and GSE118167
- Immune mediated diseases – rheumatoid arthritis: ERP114936, ERP136392, ERP117716, and ERP108327
- Immune mediated diseases – inflammatory bowel disease: GSE186582
- Immune mediated diseases – Sjogren Syndrome, sarcoidosis, dermatomyositis, anaphylaxis: GSE154926, GSE169146, GSE100152, and GSE210331
- Biomarkers of disease stage or progression: GSE136411 (multiple sclerosis) and GSE186582 (Crohn's disease)
- Studies focused on cellular differentiation (neuronal, adipose, muscular, blood, and other cells): GSE131169, GSE144052, GSE183266, GSE171101, GSE202440, GSE205976, GSE143453, GSE162883, GSE164644, GSE158578, GSE137255, GSE140914, GSE147404, GSE131697, GSE137800, GSE124392, GSE124173, and GSE206088
- Projects focused on cellular differentiation can be found by using OriginCell and CellType
- Treatment studies: ERP116751, GSE174389, GSE142591, ERP136392, and GSE169146
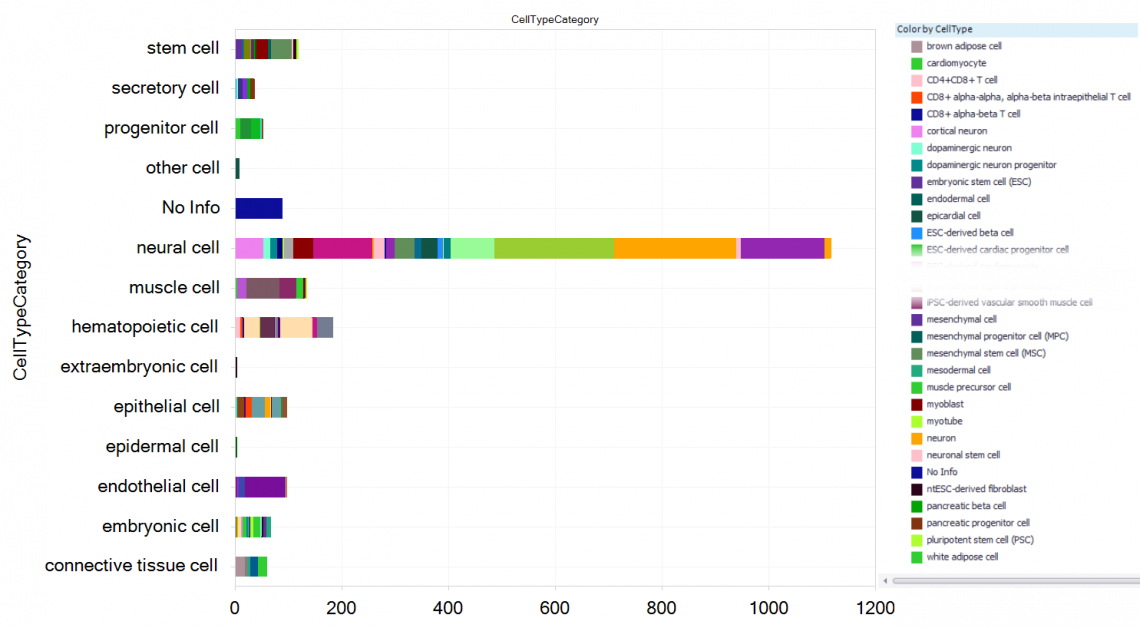
Figure 6. Profiled cell types derived from induced pluripotent stem cells (iPSC) and embryonic stem cells (ESC) in HumanDisease, including newly added projects. Filtering for OriginCell = “embryonic stem cells (ESC), induced pluripotent stem cells (iPSC)”, and grouping on the curated CellTypeCategory and CellType parameters, all derived cell types from either ESCs or iPSCs can be explored.
As part of our standard review process, comparisons for the following already-Landed projects were revised, and can be found by an updated "OSModifiedDate":
- GSE48354, E-MEXP-3787, GSE46888, GSE71645, GSE138734, GSE22501, GSE129852, GSE135467, GSE181549
MouseDisease – Curated Non-cancer disease model projects in mouse
This release adds 811samples and 981comparisons from 27datasets, including studies on:
- Body map profiles of normal tissue (brain, gastrointestinal, reproductive, endocrine, and cardiovascular): GSE219045
- Studies focused on cellular differentiation (retina, mammary gland, osteoblast, and muscular cells): GSE126370, GSE148667, GSE99399, GSE149083, GSE131369, GSE115499, GSE115369, GSE144160, GSE182848, GSE115774, GSE110434, GSE154991, GSE168139, and GSE104560 (projects focused on cellular differentiation can be found by using OriginCell and CellType)
- Eye diseases (glaucoma, macular degeneration): GSE26299, GSE3554, GSE191077, GSE191077, GSE184160, and GSE189555
- Immune mediated diseases – anaphylaxis: GSE215184
As part of our standard review process, comparisons for the following already-Landed projects were revised and can be found by an updated "OSModifiedDate": GSE130102
RatDisease – Curated Non-cancer disease model projects in rat
This release adds 502 samples and 1061 comparisons from 20 datasets, including studies on:
- Body map (cardiovascular, brain, gastrointestinal, endocrine, respiratory, and reproductive tissue): GSE219045
- CNS diseases (neuropathy, depressive disorder): PRJNA313202, GSE194289, and GSE183386
- Peripheral nerve injury: GSE177037 and GSE201025
- Cardiovascular disease – heart failure: GSE151253 and GSE186247
- Cardiovascular disease – ischemic disease: GSE184674 and GSE177078
- Cardiovascular disease – systemic and pulmonary hypertension: GSE194067, GSE160914, and GSE188348
- Eye disease – cataract: GSE186248, GSE194074, and GSE194317
If you have further questions, please contact your local QIAGEN® representative or contact our Technical Support Center at www.qiagen.com/support/technical-support
Summary of Lands 2023R1 Content Release Notes
In this release
- CGCI (DLBCL and Follicular Lymphoma) and expO (pan-cancer expression) Land databases are now available on the updated Human Genome 38/Gencode.V33
- Hundreds of new OncoHuman, HumanDisease, MouseDisease, and Single Cell datasets
- New profiled cell lines from ATCC
How to get the most out of your OmicSoft data subscription
Request new data curation
The OmicSoft team invites requests for new OncoLand and DiseaseLand expression projects to curate for upcoming releases. These will be included as part of your subscription.
Let us know which important datasets you would like curated and represented in the Lands. Public expression studies for human, mouse, and rat (GEO, SRA or Array Express) will be evaluated. Single-cell transcriptomic projects, projects for bulk RNA-seq, and commercial expression arrays from Affymetrix®, Illumina®, and Agilent® are compatible platforms. Please email omicsoft.support@qiagen.com for more information.
We are also evaluating proteomics datasets for curation starting later this year.
Use the latest Land database versions
We recommend using the latest version (“B38_GC33”) when available, as this is where you will find the newest and most comprehensively curated data.
B38_GC33 Land databases include
- Oncology Projects — OncoHuman
- Oncology Consortia – BeatAML, CGCI, expO, METABRIC, TARGET, TCGA, TRACERx
- Non-Oncology Projects – HumanDisease
- Normal Tissue profiling – GTEx, Blueprint
- Cell Line profiling – ATCC, CCLE, CellLine (GSK, NCI, Pfizer)
- Single cell Lands (UMI and non-UMI)
Please reach out to your OmicSoft Server administrator to remind them to download the latest Land databases if you notice any missing. This video provides a concise explanation of what your OmicSoft Server administrator will do.
Utilize flat file downloads of Land databases
If your subscription includes access to OmicSoft Land “text dump” flat file exports, you can request the latest data in the form of a series of indexed tab-delimited tables, or through the MyQDI web interface.
These files are perfect for larger exploratory meta-analysis and ML studies.
If you are interested in access to the latest data via flat file, ask your OmicSoft account administrator to request the links, by contacting ts-bioinformatics@qiagen.com.
Attend live and on-demand webinars
QIAGEN®'s expert Field Application Scientists routinely hold online trainings for beginning and advanced users of OmicSoft Lands data, showcasing how to utilize these resources to answer scientific questions. See the upcoming webinars, as well as recordings of previous webinars, here: https://digitalinsights.qiagen.com/webinars-and-events/
OncoHuman: Curated oncology-focused omics studies

Figure 1. New samples in OncoHuman_B38_GC33, as well as newly curated samples uplifted from Hematology_B37, grouped by DiseaseCategory.
Summary
This release adds 5769 samples and 423 comparisons from 102 datasets, as well as 22,041 samples and 1567 comparisons from 236 studies previously found in Hematology_B37, newly curated and aligned to the latest standards within OncoHuman.
Highlighted studies and topics:
- Cachexia: GSE133523, GSE130563, GSE174128, GSE186466, GSE113110
- Cancer progression: GSE77953, GSE59246, GSE80754, GSE213611, GSE136755, GSE108008, GSE193066
- Cell line: GSE151635, GSE147516, GSE189520, GSE154425, GSE173112, GSE159791, GSE163152, GSE176276, GSE198538, GSE148016, GSE157336, GSE172266, GSE129696, GSE172458, GSE197389, GSE90681, GSE152270, GSE166721, GSE166801, GSE201735, GSE200421, GSE210373
- Cell line profiling: GSE146361
- Colorectal cancer: GSE167947, GSE81558, GSE104645, GSE139279, GSE117548, GSE179975, GSE160432
- Female reproductive cancer (breast, cervix, ovary): GSE197155, GSE180280, GSE198545, GSE188893, GSE188897, GSE152322, GSE185645, GSE167977, GSE101920, GSE122697, GSE164329, GSE89657, GSE72723, GSE72723, GSE201047, GSE131978, GSE131978, GSE166539, GSE140082
- Gastrointestinal cancer (liver): GSE193080, GSE34942, GSE190967, GSE179746, GSE179746, GSE193066
- Gastrointestinal cancer (pancreas): GSE34111
- Gastrointestinal cancer (stomach): GSE66222, GSE113255, GSE182831
- Head and neck cancer: GSE132112, GSE201777, GSE173855, GSE74927, GSE178537, GSE178537, GSE159067, GSE65858, GSE40774, GSE180077, GSE41116, GSE171898, GSE181805
- Invasive front/tumor budding: E-MTAB-4065, GSE137203, GSE143985
- Male urogenital cancer: GSE97284, GSE104786, GSE101486
- Tumor Microenvironment: PRJNA482620, GSE211012, GSE178153, GSE178154, GSE142816
- Respiratory cancer (lung): GSE12771, GSE12771, GSE166720
- predictors of response to treatment: GSE190266, GSE140494, GSE104645, GSE132112, GSE179252, GSE167977, GSE166801, GSE210373, GSE213611
- Biomarkers to predict disease subtype: GSE40774, GSE66222
- Thymus cancer: GSE181815, GSE177522, GSE158997
- Tumor vs normal/adjacent pairing: GSE79793, GSE89076, GSE76297, GSE164760, GSE184733, GSE179252, GSE122401, GSE183185
Removed/reprocessed datasets or comparisons
No datasets were removed this release.
As part of our standard review process, comparisons for the following already-Landed projects were revised and can be found by an updated “OSModifiedDate”:
GSE108345;GSE111678;GSE113031;GSE116282;GSE128213;GSE146114;GSE14973;GSE150020;GSE15061;GSE15151;GSE151594;GSE152327;GSE15434;GSE15490;GSE156209;GSE15647;GSE15777;GSE16238;GSE162960;GSE16455;GSE16625;GSE16677;GSE16798;GSE178631;GSE183817;GSE30375;GSE30903;GSE31048;GSE37629;GSE48433;GSE62190;GSE62254;GSE7458;PRJNA814344;PRJNA816986.
CGCI: Genome profiling for rare diffuse large B-cell lymphoma (DLBCL) and follicular lymphoma
This uplift and update of CGCI Land incorporates reanalyzed data on the Human Genome 38/OmicSoft Gencode.V33 gene model, with new curation of metadata to match the latest OmicSoft curation standards and metadata from three CGCI-associated publications.
This release includes RNA-seq data from 109 patients, serving as a complement to the studies in OncoHuman profiling DLBCL and follicular lymphoma subtypes.

Figure 2. Comparison of overall survival between CGCI samples from diffuse large B-cell lymphoma vs follicular lymphoma patients.
expO: Longitudinal clinical annotations with gene expression data for human malignancies
This re-analysis of over 2000 samples expO microarray data on the latest mappings of probes to the Human Genome 38/OmicSoft Gencode.V33 gene model also brings 119 statistical comparisons between cohorts and updated metadata describing patient treatments and history.

Figure 3. Samples in expO_B38_GC33, grouped by DiseaseCategory and colored by DiseaseState (too numerous to list here).
For example, comparisons between groups of cancer patients based on alcohol consumption can be explored.

Figure 4. Selected comparisons from expO Land, revealing differential expression within cancers (DiseaseState), depending on reported alcohol consumption.
Cell Line Land: Minor update
Minor update of the description of five cell lines to align to the latest description of G402, MKN1, NCIH226, NCIH1666, and UMC11 cell lines.
DiseaseLand: Curated disease-focused omics studies
HumanDisease

Figure 5. New samples in HumanDisease Land, Grouped by DiseaseCategory and colored by TissueCategory, excluding control samples.
Summary
This release adds 7383 samples and 975 comparisons from 98 datasets, including studies on:
- Aging, senescence: GSE168753, GSE157363, GSE173608, GSE152738, GSE155789, GSE136344, GSE143248, GSE122918, GSE112084, GSE144703, GSE153922, GSE178115, GSE149171
- COVID-19: GSE211979, GSE180226, GSE217370, GSE200274
- Dysbiosis: GSE128189, GSE146184, GSE131320
- Microbiota (gut, vaginal): GSE174799, GSE171825, GSE137338, GSE145303, GSE30854, GSE71660, GSE113581, GSE159496, GSE18741, GSE122671, GSE171244, GSE107128, GSE54363
- Pulmonary fibrosis: GSE70866, GSE70866, GSE92592
- Sarcodiosis: GSE56998, GSE75023, GSE110779, GSE110777, GSE42826, GSE42831, GSE42830, GSE42832
- Infection diseases (tuberculosis, pneumonia): GSE42827, GSE42825, GSE83456, GSE116014, GSE112104, GSE134550, GSE134564, GSE134565, GSE147689, GSE147690, GSE147691, GSE139871, GSE153326, GSE153340, GSE152532, GSE197408, GSE133803, GSE139825
- Muscular disease(dystrophy, myopathy): GSE164874, GSE205421, GSE26852, GSE106292
- Post-traumatic shock syndrome: GSE109409, GSE114852, GSE114407
- Transplant (kidney): GSE107506, GSE107503
- METSIM study (metabolic syndrome): GSE70353
Removed/reprocessed datasets or comparisons
No datasets were removed this release.
As part of our standard review process, comparisons for the following already-Landed projects were revised and can be found by an updated “OSModifiedDate”:
E-MTAB-6814;GSE107011;GSE130665;GSE157159;GSE157440;GSE18686;GSE20098;GSE34309;GSE35955;
GSE35956;GSE35957;GSE35958;GSE49454;GSE51440;GSE54293;GSE63142;GSE7624;GSE83482.
Renamed: syn21861227 to syn21861181.
Moved from PEDIATRICS: GSE34309.
MouseDisease

Figure 6. New samples in MouseDisease, grouped by DiseaseCategory and colored by TissueCategory.
Summary
This release adds 542 samples and 183 comparisons from 35 datasets, including studies on:
- Aging and atrophy: GSE129205 PRJEB24709 PRJEB30015 GSE156283 GSE156343 GSE134111 GSE218370 GSE135584 GSE168964 GSE179368 GSE134241 GSE134928 GSE184902 PRJEB30776
- Infertility: PRJEB29092, PRJEB21967
- Nervous system: PRJEB5489, GSE107129, PRJEB2572, PRJEB22236, PRJEB30100, PRJEB21214
- Metabolism: PRJEB24323, PRJEB7122, PRJEB13034, PRJEB13052
Removed/reprocessed datasets or comparisons
GSE29992 GPL13112 was removed this release.
As part of our standard review process, comparisons for the following already-Landed projects were revised and can be found by an updated “OSModifiedDate”: GSE107543;GSE7657.
Single Cell Lands
Human UMI

Figure 7. Curated cell clusters from new datasets in HumanUMI Land, grouped by ClusterCellTypeCategory and colored by ClusterCellType (too numerous to list here).
This release adds 51 new datasets containing 2,469,595 cells in 135 cell maps from 40 tissues. One focus of this release is expression of hematopoietic cell types in normal and disease.
New statistical comparisons between clusters as well as ClusterCellTypes were added to reveal differential expression between cell types.

Figure 8. Differential expression between curated regulatory T cells and other cells in Dimension Reduction “CellMaps”.
Biomarkers can be confirmed with the Percentage Expression View in newly curated datasets of hematopoietic cells, revealing cell-specific expression.

Figure 9. Percentage of cells expressing four genes detected as up-regulated in Regulatory T-cells, grouped on the Y-axis by manually curated ClusterCellType.
New columns added at sample level:
- AgeSummary — Aggregates subject age related information
Mouse UMI

Figure 10. Dimension Reduction “CellMaps” of new curated MouseUMI projects, colored by OmicSoft’s manually curated ClusterCellType.
This release adds 2 new datasets containing 198,407 cells in 4 cell maps from 5 tissues in the following therapeutic areas: pulmonary, renal disease, gastroenterology, oncology, and renal disease.
New columns added at sample level:
- AgeSummary — Aggregates subject age related information
HCL:
All datasets were revised and aligned to the current curation standards.
New columns added at Project level:
- CellAnnotationMethod — Whether ClusterCellType annotations were defined by author's cell-level annotations, by inspection of marker gene expression in computational clusters, or by SVM-based cell type prediction
- ProjectPipeline — Whether processing started with unaligned reads, or author-provided gene-level counts
- StudyRevision — is a new project metadata field that captures significant differences between the OmicSoft representation of a dataset and the original dataset (i.e., as found in the sources). These significant differences do not include standard transformations, such as data reprocessing through OS pipelines, metadata formatting due to the use of controlled vocabularies or application of curation protocol. For example, this field will be used by curators to capture changes caused by additional input from the authors regarding the dataset, after they were contacted to clarify metadata inconsistencies.
New columns added at sample level:
- TissueDissociationMethod — Method used for tissue dissociation
- TissueDissociationTimeTemp — Time and temperature for tissue dissociation
- LibraryVersion — Version of the library kit used during sequencing
- AgeSummary — Aggregates subject age related information
HCL_CulturedCellFromES GPL11154 was removed and will be landed as a separate project in an upcoming release.
ATCC Cell Line Land Updates

Figure 11. Summary of samples in ATCC_Human_B38_GC33 and ATCC_Mouse_B38, grouped by TissueCategory.
ATCC Human Summary
This release adds 218 samples from 47 unique cell lines.
ATCC Mouse Summary
This release adds 15 samples from 3 unique cell lines.
Highlighted topics
This release includes all kidney cell lines for human and mouse from the ATCC collection.

Figure 12. Cell lines available in ATCC_Human_B38_GC33 Cell Line Land now includes all kidney related cell lines from the ATCC Human Cell Line Collection that fall under the urinary system TissueCategory. Graph is grouped by TissueCategory and colored by the DiseaseCategory metadata field.
Revisions to data processing pipeline
Sequencing projects in OncoHuman and HumanDisease were fully regenerated using an updated Deseq2 (R) script to update Numerator and Denominator calculations in comparisons.tsv flat files.
New additions to single cell annotation level metadata including the Cluster Name field, which contains unique cell map names that reflect the paper cell map on which it is based; Meta Data Column and Metadata Column Value, which reflect the sample level metadata used in the Cell Map construction; and lastly, cluster level clarifications in Cluster Notes and Cluster Marker genes used in annotation.
In case you missed it
Learn more about OmicSoft’s new APIs
OmicSoft Lands are now searchable with new, powerful Python and R APIs that harness the syntax power of SQL to seamlessly search across all databases to find exactly the data you are interested in.
Learn more on this blog post: https://digitalinsights.qiagen.com/news/blog/discovery/boost-your-agility-and-speed-in-drug-development/
Or this introductory video: https://tv.qiagenbioinformatics.com/video/83992555/omics-data-queries-made-simple

Figure 13. Schematic of the new OmicSoft Lands API. Python or R API clients submit SQL queries to the OmicSoft Lands API query engine, which identifies all curated data in the Lands collection. Matching datasets are quickly returned to the client environment for analysis.
If you have further questions, please contact your local QIAGEN® representative or contact our Technical Support Center at www.qiagen.com/support/technical-support
QIAGEN OmicSoft Lands release notes 2022R4
Here is a quick overview of what is new in this release:
- Hundreds of ‘omics studies have been added to OncoHuman and DiseaseLand.
- CCLE has been updated to DepMap 2022.
- BeatAML, METABRIC and CellLine Lands updates have been made to Human Genome 38.
- New Single Cell Land datasets and new CellType vs Others comparisons have been added.
How to get the most out of your OmicSoft subscription
Request new data curation
The OmicSoft team invites requests for new OncoLand and DiseaseLand expression projects to curate for upcoming releases. These will be included as part of your subscription.
Let us know which important datasets you would like curated and represented in the Lands. Public expression studies for Human, Mouse and Rat (GEO, SRA or Array Express) will be evaluated. Single-cell transcriptomic projects, projects for bulk RNA-seq and commercial expression arrays from Affymetrix, Illumina and Agilent are compatible platforms. Please email omicsoft.support@qiagen.com for more information.
We are also evaluating proteomics datasets for curation starting later this year.
Use the latest Land database versions
We recommend using the latest version (“B38_GC33”) when available, as this is where you’ll find the newest and most comprehensively curated data.
B38_GC33 Lands include OncoHuman, HumanDisease, GTEx, Blueprint, CCLE, ENCODE_RNAbinding, TCGA, TARGET, TRACERx, METABRIC, CellLines and BeatAML, in addition to the latest Single Cell Lands.
Please reach out to your OmicSoft Server administrator to remind them to download the latest Land databases if you notice any missing databases. This video provides a concise explanation of what your OmicSoft Server administrator will do.
Use flat-file downloads of Land databases
If your subscription includes access to OmicSoft Land “text dump” flat-file exports, you can request the latest data in the form of a series of indexed tab-delimited tables or through the MyQDI web interface.
These files are perfect for larger exploratory meta-analysis and ML studies. If you are interested in access to the latest data via flat file, ask your OmicSoft account administrator to request the links.
Attend live and on-demand webinars
QIAGEN's expert Field Application Scientists routinely hold online trainings for beginning and advanced users of OmicSoft Lands data, showcasing how to use these resources to answer scientific questions. See the upcoming webinars, as well as recordings of previous webinars, here: https://digitalinsights.qiagen.com/webinars-and-events/
Learn more about OmicSoft’s new APIs
OmicSoft Lands are now searchable with new, powerful Python and R APIs that harness the syntax power of SQL to seamlessly search across all databases to find exactly the data you are interested in. Learn more on this blog post.

Figure 1. Schematic of the new OmicSoft Lands API. Python or R API clients submit SQL queries to the OmicSoft Lands API query engine, which searches all curated data in the Lands collection. Matching datasets are quickly returned to the client environment for analysis.
OncoHuman Updates

Figure 2. New samples in OncoHuman_B38_GC33, grouped by DiseaseCategory.
Summary
This release adds 6926 samples and 432 comparisons from 95 datasets. In addition, this release incorporates 3316 samples and 584 comparisons from 67 datasets of Hematology_B37 Land, which were revised and aligned to current curation standards and added to OncoHuman.
Highlighted dataset
- Leucegene project: GSE49601 GPL11154, GSE62190 GPL11154, GSE67039 and GPL11154 were revised to include new metadata.
Colorectal peritoneal metastases study GSE190609, with paired primary tumor samples, was added.

Figure 3. Heatmap of RNA-seq expression of the top 109 differentially expressed genes between primary colorectal cancers and paired peritoneal metastases. Samples were grouped by OncoSampleType (Metastatic vs Primary Tumor) and SubjectID to confirm consistent differential expression between the groups, which are indicated with colored bars at the bottom border.
Highlighted topics
- Breast cancer: GSE199135, GSE167213, GSE193542, GSE210399, GSE165914, GSE178708, GSE157284, GSE162228
- Ovarian cancer: GSE191231, GSE193875, GSE201203, GSE117765, GSE190902, GSE195984
- Colorectal cancer: GSE167395, PRJNA814344, GSE179979, GSE146587, GSE161023, GSE164541, GSE196006, GSE162960, GSE159216, GSE190609, GSE180440, GSE200427, PRJEB41875, GSE128213, GSE178120, GSE183202, GSE132024, GSE209746, GSE158559, GSE106584, GSE170999, GSE183984, GSE197802, GSE18088, GSE80606, PRJNA816986, GSE157004
- Gastric cancer: GSE84433, GSE84426, GSE183136
- Hematologic cancers: (ALL, AML, MM and others): GSE148658, GSE137768, GSE115895, GSE115464, GSE95648, GSE165405, GSE138803, GSE138659, GSE37389, GSE150372, GSE127180, GSE39041, GSE114085, GSE147931, GSE174537, GSE72213, GSE138717, PRJEB30312
- Lung cancer: GSE74777, GSE141755, GSE142186, GSE162353, GSE133518
- Relapsed or refractory disease (various cancers): GSE195933, GSE151594, GSE183817, GSE171806, GSE162095
- Drug efficiency studies (mostly treated vs control): GSE151594, GSE146362, GSE155559, GSE202434, GSE157982, GSE171806, GSE193542, GSE210399, GSE191231, GSE201203, GSE183984, GSE84433, GSE84426, GSE183136, GSE196038, GSE150372, GSE152755, GSE120844, GSE138717, GSE133518, GSE199107
- Studies containing paired samples (primary tumor–metastasis, tumor–nontumor): GSE162228, GSE146587, GSE164541, GSE196006, GSE190609, GSE180440, GSE200427, GSE128213, GSE167488, GSE38476
- Studies investigating the value of different prognostic biomarkers: GSE197802, GSE18088, GSE183136, GSE74777, GSE138717, GSE99420
- Other additions: GSE174302 , GSE182824 , GSE176559 , GSE142514 , GSE54268 , GSE54267 , GSE54266 , GSE54265 , GSE54264 , GSE51984 , GSE169038 , GSE178631
Removed or reprocessed datasets or comparisons
No datasets were removed from this release.
As part of our standard review process, comparisons for the following already-Landed projects were revised and can be identified with an updated “OSModifiedDate”:
GSE68468 GPL96, GSE61723 GPL16686, GSE147043 GPL18573, GSE26980 GPL5175, GSE94035 GPL11154, GSE13906 GPL570, GSE94035 GPL11154
BeatAML — New data and metadata
This update of the BeatAML study integrates genomic and drug response data published in Bottomly et al, 2022 as well as proteomic data published in Gosline et al., 2022, increasing the utility of these data for those studying AML and related cancers.
CCLE — DepMap updates and updated data dictionary
CCLE_B38_GC33 has been updated to include updates from in DepMap 2022Q2, including 28 new cell lines, and a new metadata dictionary is available: https://resources.omicsoft.com/downloads/land/CCLE/CCLE_B38_GC33_DataDictionary.xlsx
New metadata fields describe the following parameters:
- ParentID[DepMap] and SubjectID[DepMap]:The parental cell line IDs and/or the SubjectID from which the cell line was derived.
- DiseaseState[Cellosaurus] and DiseaseState[Cellosaurus][NCItCode]: The DiseaseState associated with each cell line, as annotated in the Cellosaurus repository.
- CellDescription: This now includes model manipulation strategies.
Additional OmicSoft CV fields added this release: CellLine, CellType, AgeCategory, GeneDependency[XPR1][PMID: 35437317], PairingType, PairingStatus, AgeSummary, SampleMaterial, SampleType, Molecule
CellLine Land — Integrating GSK, NCI and Pfizer cell-line profiling datasets
This release includes the new CellLine_B38_GC33 Land, which combines and updates the Lands CellLine_GSK_B37, CellLine_NCI_B37 and CellLine_Pfizer_B37 with new metadata and the latest standards. Use these data as a complement to CCLE_B38_GC33 to explore ‘omics and metadata information for nearly 2000 cell lines.

Figure 4. Cell lines available in CellLine Land CellLine_B38_GC33. CellLine Land combines multi-omics data from three profiling projects (GSK, NCI and Pfizer) that are grouped on the Y-axis and colored according to the curated Histology metadata field.
METABRIC — Breast cancer multi-omics study
Data from the Molecular Taxonomy of Breast Cancer International Consortium (METABRIC) trial have been re-analyzed and re-curated on Human Genome 38 and Gencode.V33. 4128 samples with curated metadata, CNV (1992 samples) and microarray Expression Intensity Probes (2136 samples).

Figure 5. Distribution of METABRIC samples grouped by GeneticSubtype, and colored according to OncoSampleType.
DiseaseLand updates

Figure 6. Distribution of new samples added to HumanDisease, MouseDisease and RatDisease (excluding controls), grouped by DiseaseCategory.
HumanDisease
This release of HumanDisease adds 3064 samples and 541 comparisons from 75 datasets.
Highlighted topics
- Aging: GSE164012, GSE150137, GSE148219, GSE148219
- CNS diseases (bipolar disorder, epilepsy, schizophrenia): GSE134497, GSE7624, GSE62699, GSE191248, GSE174704, GSE165604, GSE133534, GSE121376, GSE119290, GSE93577, GSE26629
- Immune cells profiling: GSE174284, GSE128163, GSE81975, GSE55843, GSE184784, GSE168642, GSE151079, GSE112923
- Diabetes mellitus: GSE203346, GSE164416, GSE159984, GSE159984, GSE157988, GSE156903, GSE193273, GSE164338, GSE113969, GSE156248, GSE166502, GSE166467, GSE161355, GSE156061
- Immune mediated diseases (IBD, psoriasis): GSE207022, GSE206285, GSE201397
- Viral diseases (HIV, CoV, mononucleosis, Zika): GSE132228, GSE85599, GSE152418, GSE151453, GSE144585, GSE168658
- Transplant: GSE192444 (the value of monitoring cfDNA to assess transplant rejection), GSE146495, GSE145780
- Metabolic diseases (dyslipidemia, obesity): GSE126352, GSE156247, GSE197285, GSE159955, GSE144414
- Kidney disease: GSE163603, GSE175759
- Other additions: GSE111977, GSE117887, GSE12293, GSE125805, GSE125999, GSE128367, GSE129247, GSE134048, GSE134555, GSE140844, GSE141136, GSE143692, GSE158312, GSE159337, GSE159924, GSE163244, GSE181076, GSE181258, GSE182875, GSE53667, GSE54112, PRJEB20634, PRJNA736745, syn21861227
Removed or reprocessed datasets or comparisons
No datasets were removed from this release.
As part of our standard review process, comparisons for the following already-Landed projects were revised, and can be identified with an updated “OSModifiedDate”:
GSE30933 GPL6255, GSE35957 GPL570, GSE74988 GPL11532, GSE137619 GPL21290, GSE7036 GPL570, GSE33070 GPL6244, GSE16031 GPL6106, GSE16031 GPL6097
MouseDisease
This update of MouseDisease adds 1499 samples and 564 comparisons from 62 datasets
Highlighted topics
- Atherosclerosis: GSE163657, GSE193118, GSE164517, GSE90835, GSE104914, GSE143162, GSE94044, GSE120565, GSE109259, GSE102558, GSE179952, GSE116569, GSE118463, GSE191044, GSE180649, GSE93954
- Stroke: GSE173714, GSE173713, GSE137482, GSE116878, GSE128623
- Metabolic disease or dyslipidemia: GSE102072, GSE120120, GSE136792, GSE136797, GSE135734, GSE125946
- Liver disease: GSE179394, GSE179394
- Kidney disease: GSE69556
- Diabetes mellitus: GSE153431, GSE142204
- Embryo or fetal tissue profiling: GSE55966, GSE72491, GSE33979
- Adult tissue profiling: GSE74747, GSE33141, GSE67991, GSE53105, GSE65388, GSE77997, GSE63810 (brain, heart, kidney, liver, lung, skin, spleen, testis, thymus, eye or retina, pancreas, bone, hair follicle)
- Other additions: GSE12293, GSE126481, GSE134005, GSE140369, GSE162660, GSE163060, GSE164672, GSE185734, GSE186971, GSE190156, GSE190812, GSE22131, GSE45278, GSE58261, GSE60243, GSE68155, GSE68283, GSE68284, GSE72095, GSE72165, PRJEB20634
Removed or reprocessed datasets or comparisons
No datasets were removed from this release.
As part of our standard review process, comparisons for the following already-Landed projects were revised, and can be identified with an updated “OSModifiedDate”: GSE40156 GPL8321, GSE10000 GPL8321, GSE29752 GPL11002
RatDisease
This RatDisease update adds 492 samples and 202 comparisons from 20 datasets.
Highlighted topics
- Brain injury and stroke: GSE115614, GSE171144, GSE148350, GSE162072
- Immune-cell profiling: GSE156188
- Metabolic disease, obesity: GSE149829, GSE176298
- Osteoarthritis: GSE99021
- Tissue profiling: retina GSE133563 (glaucoma model), GSE110675; muscle GSE118825 (aging), GSE162565 (muscle repair)
- Cardiovascular disease: GSE130102, GSE159722, GSE107551, GSE135172
- Other additions: GSE114031, GSE131012, GSE141650, GSE147732
Removed or reprocessed datasets or comparisons
No datasets were removed from this release.
As part of our standard review process, comparisons for the following already-Landed projects were revised, and can be identified with an updated “OSModifiedDate”: GSE57800 GPL1355, GSE57805 GPL1355, GSE57815 GPL1355, GSE57811 GPL1355
Single Cell Lands
The latest release of Single Cell Lands adds 77 new projects with 4294 comparisons to HumanUmi_B38_GC33 and 18 new projects with 664 new comparisons to MouseUmi_B38_GC33.
In addition, all data from HumanUmiLite_B38_GC33 and MouseUmiLite_B38_GC33 are now within HumanUmi_B38_GC33 and MouseUmi_B38_GC24; you can safely delete the “Lite” Lands.
New to this release are curated “cell type” comparisons, which complement the comparisons between computationally identified clusters to reveal differences between distinct cell types.
For example, comparisons can be found between Schwann cells and other cell types in a CellMap-dimension reduction analysis. In each comparison, all clusters curated as “Schwann cell” in a CellMap were grouped together and compared to all other cells in the CellMap. This analysis reveals genes that are particularly up- or down-regulated in Schwann cells, such as ERBB3. Other visualizations, such as the Percentage Cells Expressing and Gene Expression Overlay Views, can confirm that this is supported by evidence from multiple projects.

Figure 7. After searching for pre-computed comparisons between Schwann cells and other cells, the top up-regulated genes were visualized with the Significant Genes table, revealing genes including ERBB3, CADM3 and CD9.

Figure 8. Searching for ERBB3 expression across selected datasets that included Schwann cells reveal consistently high expression across studies, as shown in the Percentage Expressing Cells plot in which cells are grouped by ClusterCellType and ProjectName.

Figure 9. The Gene Expression Overlay plot reveals up-regulation of ERBB3 in multiple CellMaps (top panel) with curated Schwann Cell populations (bottom panel). Blue arrows indicate curated Schwann Cell clusters, which were compared to all other cells in a CellMap of new Cell Type vs Others comparisons.
Revisions to the OmicSoft curation protocol
Project.StudyRevision is a new Project metadata field that captures significant differences between the OmicSoft representation of a dataset and the original dataset (i.e., as found in the sources). These significant differences do not include standard transformations, such as data reprocessing through OS pipelines, metadata formatting due to the use of controlled vocabularies or application of curation protocol.
For example, this field will be used by curators to capture changes caused by additional input from the authors regarding the dataset, after they were contacted to clarify metadata inconsistencies.
Whenever landed metadata has been altered by the addition of author input, Project.StudyRevision will contain “Authors Contacted” and Project.Comments will end with the same string (“Authors Contacted”) followed by a short explanation of the revisions made according to the information received from the authors.
DiseaseState curation for CCLE_B38_GC33 2022R4 uses CCLE sources (repository and paper) rather than using Cell Line description defined in the OmicSoft ontology to maintain consistency with the CCLE terminology.
QIAGEN OmicSoft Lands release notes 2022R3
In this release: Major TARGET Pediatric Cancer update; integration of all Pediatrics Land data into OncoHuman_B38_GC33; over 1000 new statistical comparisons derived from GTEx data and new projects in HumanDisease and MouseDisease.
Reminder: Get the most out of your OmicSoft subscription
Invitation to request new data curation
The OmicSoft team invites requests for new OncoLand, DiseaseLand and Single Cell Land expression projects to curate for upcoming releases. These will be included as part of your subscription.
Let us know if there are important datasets that you would like to see curated and represented in the Lands. Public expression studies for Human, Mouse and Rat (GEO, SRA or Array Express) will be evaluated. Single-cell transcriptomic projects, projects for bulk RNA-seq and commercial expression arrays from Affymetrix, Illumina and Agilent are compatible platforms. Please email omicsoft.support@qiagen.com for more information.
We are also evaluating proteomics datasets for curation starting later this year.
Updated Land versions
Updates to Lands data are being processed on Human genome B38 and GENCODE Gene Model, version 33 (“B38_GC33” Lands), including OncoHuman, HumanDisease, GTEx, Blueprint, CCLE, ENCODE_RNAbinding, TCGA, TARGET and TRACERx, in addition to the latest Single Cell Lands.
We recommend using the B38_GC33 version when available, as this is where you’ll find the newest and most comprehensively curated data.
Flat file “text dumps”
If your subscription includes access to OmicSoft Land “text dump” flat file exports, you can request the latest data in the form of a series of indexed tab-delimited tables. These files are perfect for larger exploratory meta-analysis and ML studies. If you are interested in access to the latest data via flat file, ask your OmicSoft account administrator to request the links. Keep an eye out for an announcement of new Lands APIs for powerful cross-database queries.
OncoLand — TARGET update and new OncoHuman data
TARGET — Major update of multi-omics data for pediatric cancers
The Therapeutically Applicable Research to Generate Effective Treatments (TARGET) program applies a comprehensive genomic approach to determine molecular changes that drive childhood cancers.
For this release, TARGET data have been reprocessed for Human Genome B38 and GENCODE gene model, version 33. As of publication, this corresponds to the latest data release, August 24, 2020.
Data updates include a 50% increase in the number of samples (6127 samples) for 19 diseases, 317 curated metadata fields, including information from 41 publications reviewed for this update, and 98 statistical comparisons.
Data types available for exploration in this update include Copy Number Variation (2719 samples), RNA-seq (1491), DNA-seq somatic mutation (2026) and miRNA-seq (2425).

Figure 1. Distribution of samples in TARGET_B38_GC33, grouped by DiseaseState. Bars are color coded according to OncoSampleType, which includes 19 pediatric cancers.
As part of this major update to TARGET Land, nearly 100 statistical comparisons between groups of samples were modeled by the OmicSoft team, revealing differences between genetic subtype, gender, histology, metastatic status and more.

Figure 2. Differential expression of genes from patients with acute lymphocytic leukemia (ALL) grouped by genetic subtype (TAL1 subtype vs HOXA subtype) reveals expression-based markers differentiating these populations (top panel); significantly higher expression of PlexinD1 was observed for ALL patients with HOXA genetic subtype compared to those with the TAL1 genetic subtype (bottom panel).
OncoHuman — Integrated database of thousands of curated oncology ‘omics datasets

Figure 3. Distribution of samples added to the latest release of OncoHuman. Samples are grouped by Disease Category and color coded according to Tissue Category.
This release adds 2426 samples and 230 comparisons from 43 datasets included in the following therapeutic areas:
- Dermatology: GSE141465, GSE184398
- Endocrinology, metabolism, bone: GSE112202, GSE138198, GSE153659, GSE184398, GSE9195
- Gastroenterology: GSE155887, GSE184398, GSE21293, GSE41568, GSE45168, GSE47404, GSE51021, GSE57303, GSE59948, GSE67508, GSE87410, GSE88802
- Hematology, coagulation: GSE151774, GSE158438
- Immunomodulators: GSE151774, GSE155887
- Neurology: GSE171197, GSE184398
- General oncology: E-MTAB-62, GSE112202, GSE119400, GSE12093, GSE122698, GSE125113, GSE126548, GSE12763, GSE13787, GSE138198, GSE141465, GSE143152, GSE151072, GSE151774, GSE153659, GSE155887, GSE1561, GSE158438, GSE167573, GSE168845, GSE171197, GSE174167, GSE175648, GSE184398, GSE20318, GSE21293, GSE3744, GSE41568, GSE42749, GSE45168, GSE47404, GSE51021, GSE57303, GSE57422, GSE59948, GSE6596, GSE67508, GSE69630, GSE7880, GSE87410, GSE88802, GSE9195, GSE98979
- Pulmonology: GSE119400, GSE122698, GSE125113, GSE126548, GSE184398, GSE20318, GSE42749, GSE57422, GSE69630, GSE7880, GSE87410, GSE98979
- Renal disease: GSE167573, GSE168845, GSE175648, GSE184398
- Urologic: GSE184398
Datasets or comparisons removed or reprocessed:
No datasets were removed this release.
As part of our standard review process, comparisons for the following already-Landed projects were revised. These comparisons can be identified by the content of “OSModifiedDate”:
GSE33939 GPL570, GSE33939 GPL570, GSE6566 GPL570, GSE145062 GPL20301, GSE102886 GPL10558, GSE114453 GPL20301, GSE11151 GPL570, GSE15824 GPL570, GSE5824 GPL96, GSE16354 GPL570, GSE6740 GPL96, GSE138077 GPL20795, GSE115853 GPL20795, GSE140101 GPL16791, GSE25087 GPL570, GSE10797 GPL571, GSE51798 GPL570, GSE162894 GPL24676
Pediatrics data integration into OncoHuman
To enable better cross-project analysis of oncology projects including pediatric cancers, Pediatrics Land has been recurated and incorporated into OncoHuman_B38_GC33.
This release includes 9384 samples and 542 comparisons from 144 datasets originally found in Pediatrics_B37.
Highlights of the recuration effort
- Revised curation of fields to maintain consistency between projects within OncoHuman, including updated curation of DiseaseState, DiseaseStatus, RelapseStatus, MetastasisStatus, CellDescription, SampleOrigin, ConcurrentDisease, ExperimentGroup, OncoSampleType, DiseaseSubtype, Survival columns, TissueRegion, GeneticSubtype
- DiseaseStatus describes the cancer status (OncoSampleType) at the time the sample was collected from the subject
- MetastasisStatus describes whether the patient providing the sample had developed metastasis by the time of the follow up
- RelapseStatus describes whether the patient providing the sample exhibited recurrence after a period of improvement and by the time of follow up
- MutationStatus and MutationType define the mutation status of a given gene (MutationStatus[GeneName]) and the type of mutation identified for the gene (MutationType[GeneName]), available only when provided by the authors.
- Revised DiseaseState unifies “normal control” and “disease control” values under “control”
Integrated projects from Pediatrics_B37
- Hematologic cancer: GSE10172; GSE10609; GSE10792; GSE108088; GSE13351; GSE13425; GSE13576; GSE14062; GSE14286; GSE14471; GSE17195; GSE17459; GSE17703; GSE19143; GSE19475; GSE19577; GSE20910; GSE2191; GSE26281; GSE26713; GSE2677; GSE27237; GSE28460; GSE28703; GSE29326; GSE29986; GSE30392; GSE32962; GSE33315; GSE34670; GSE35504; GSE39816; GSE41621; GSE42001; GSE42038; GSE42056; GSE42221; GSE42765; GSE43176; GSE43209; GSE45249; GSE46170; GSE4698; GSE47051; GSE50999; GSE52891; GSE52991; GSE55876; GSE55877; GSE56488; GSE56599; GSE57795; GSE58290; GSE60926; GSE61999; GSE635; GSE63988; GSE64905; GSE66638; GSE67684; GSE69346; GSE74299; GSE7440; GSE74460; GSE75461
- Nervous system cancer: E-TABM-1107; GSE100427; GSE108088; GSE109401; GSE12907; GSE12992; GSE13267; GSE14295; GSE16155; GSE17714; GSE18271; GSE19404; GSE21166; GSE26576; GSE28238; GSE28409; GSE29683; GSE29684; GSE30074; GSE32374; GSE34280; GSE3446; GSE34824; GSE35133; GSE35493; GSE37382; GSE37384; GSE38330; GSE39182; GSE39218; GSE42762; GSE43392; GSE44971; GSE47407; GSE49243; GSE50385; GSE51020; GSE54720; GSE5675; GSE59983; GSE60899; GSE63296; GSE67851; GSE68956; GSE70576; GSE73066; GSE74195; GSE77947; GSE83266; GSE8596; GSE86574; GSE89446; GSE90689
- Musculoskeletal system cancer: GSE100427; GSE108088; GSE12865; GSE14827; GSE16088; GSE34620; GSE37371; GSE40018; GSE40021; GSE45544; GSE73166; GSE74970; GSE8596; GSE92689
- Urinary system cancer: GSE10320; GSE108088; GSE11024; GSE11482; GSE2712; GSE53224; GSE68956; GSE90633
- Gastrointestinal system cancer: GSE108088; GSE75271; GSE75284; GSE83518
Pediatrics_B37 datasets or comparisons excluded from integration into OncoHuman
- Datasets that were redundant: GSE74183 GPL17586 (redundant with GSE75461), GSE2351 GPL96 (redundant with GSE635 GPL96), GSE28497 GPL96 (redundant with GSE33315 GPL96), GSE29686 GPL570 (superseries, replaced by GSE29684 GPL570),
- Content that was re-assigned to HumanDisease: GSE34309 GPL571, GSE19919 GPL6480
- Content already in OncoHuman: GSE37418 GPL570, GSE22139 GPL570
- Methylation content (will be added to future release): GSE102994 GPL13534, GSE36278 GPL13534, GSE44684 GPL13534, GSE49377 GPL13534, GSE52556 GPL13534, GSE54719 GPL13534, GSE56600 GPL13534, GSE61044 GPL13534, GSE73801 GPL13534, GSE77241 GPL13534, GSE92577 GPL13534, GSE95486 GPL13534
- Very old or unsupported data E-TABM-1107 GPL6801
DiseaseLand – New datasets
HumanDisease

Figure 4. Distribution of samples added in the latest release of HumanDisease, grouped by Disease Category (excluding normal control and disease control) and color coded by Tissue.
This release adds 3484 samples and 1037 comparisons from 123 datasets, including studies on
- Cardiovascular disease (atherosclerotic disease, cardiomyopathy of various causes, heart failure, pulmonary hypertension): GSE109048, GSE111782, GSE112630, GSE118882, GSE120567, GSE120836, GSE120895, GSE124026, GSE125126, GSE125990, GSE126198, GSE130036, GSE131793, GSE132651, GSE143953, GSE152669, GSE153555, GSE155495, GSE159243, GSE175739, GSE188238, GSE159610, GSE144932, GSE193776, GSE194079, GSE194080, GSE160145
- Endocrinology, metabolism, bone (Type 1 DM, : GSE111006, GSE111010, GSE111016, GSE151066, GSE158292, GSE163731, GSE150411
- Gastroenterology (celiac disease, hepatic disease): GSE146441, GSE126409, GSE164266
- Infectious disease (viral): GSE141498, GSE155925, GSE155986, GSE164366, GSE166337, GSE24132, GSE135192
- Neurology: GSE137143, GSE145348, GSE145349
- Pulmonology: E-MTAB-5029, ERP136980, GSE149413, GSE43402
- Rheumatology (arthritis): GSE168505, GSE171652, GSE176199, GSE176223, GSE183531, GSE185064
- Immune cell biology (T cells mainly derived from peripheral blood, cord blood, gut, tonsil and normal and diseased tissues): GSE17851, GSE20934, GSE1460, GSE158439, GSE138851, GSE166327, GSE119732, GSE174779, GSE164276, GSE175550, GSE162051, GSE125916, GSE151073, GSE99374, GSE81408, GSE69090, GSE28200, GSE17354, GSE122941, GSE129906, GSE131743, GSE137380, GSE144108, GSE154928, GSE163260, GSE164086, GSE23663, GSE33374, GSE62095, GSE62096, GSE62097, GSE93902, GSE105095, GSE129251, GSE129356, GSE132799, GSE135452, GSE135936, GSE145527, GSE146438, GSE151204
- Aging (of muscle tissue, immune system): GSE111010, GSE111006, GSE60216
Datasets or comparisons removed or reprocessed for HumanDisease:
No datasets were removed this release.
As part of our standard review process, comparisons for the following already-Landed projects were revised, and can be identified by the content of “OSModifiedDate”: GSE40240 GPL6244, GSE11909 GPL96, GSE11909 GPL97, GSE35957 GPL570, GSE10161 GPL96, GSE42771 GPL570, GSE66385 GPL16791, GSE74158 GPL10558, GSE101508 GPL10558, GSE13699 GPL6883, GSE4172 GPL570, GSE120852 GPL16791, GSE95038 GPL16686, GSE18876 GPL5175, GSE115348 GPL20301, GSE145358 GPL18573, GSE144826 GPL17692, GSE7247 GPL570, GSE9927 GPL570, GSE11908 GPL96, GSE11908 GPL97, E-MTAB-4377 GPL15433
MouseDisease

Figure 5. Distribution of samples added in the latest release of Mouse Disease, grouped by Disease and color coded by Tissue.
This release adds 350 samples and 1037 comparisons from 18 datasets, including studies on
- Cardiovascular disease (myocarditis, ischemic stroke): GSE155423, GSE107983
- Endocrinology, metabolism, bone (dyslipidemias, obesity): GSE131348, GSE138810, GSE146470, GSE147412, GSE151182, GSE156254, GSE157201, GSE163652, GSE131348, GSE159882, GSE168676, GSE184836
- Infectious disease (viral): GSE111861
- Neurology: GSE111031, E-MTAB-10601
- Pulmonology (COPD): GSE119257
Datasets or comparisons removed or reprocessed:
No datasets were removed this release.
As part of our standard review process, comparisons for the following already-Landed projects were revised, and can be identified with the content of “OSModifiedDate” : GSE101823 GPL17021, GSE101823 GPL21103, GSE103908 GPL19057, GSE113924 GPL19057, GSE125015 GPL21493, GSE126642 GPL17791, GSE131914 GPL21103, GSE132298 GPL6246, GSE13379 GPL1261, GSE139601 GPL16570, GSE147034 GPL17021, GSE28043 GPL6246, GSE35751 GPL1261, GSE35758 GPL1261, GSE35761 GPL1261, GSE35763 GPL1261, GSE35765 GPL1261, GSE38688 GPL6885, GSE40395 GPL4134, GSE41095 GPL1261, GSE42880 GPL13112, GSE50855 GPL10787, GSE55096 GPL1261, GSE60186 GPL1261, GSE60414 GPL11180, GSE61847 GPL6246, GSE62169 GPL16570, GSE65094 GPL1261, GSE77720 GPL13112, GSE85339 GPL13912, GSE95739 GPL13112
GTEx — Over 1000 new statistical comparisons, plus proteomics data
In the latest update, detailed comparisons were constructed between samples using detailed tissue information (TissueDetail_GTEx), sex (Gender) and age (AgeRange[years]). These comparisons revealed statistically relevant difference in expression between the following.
TissueDetail_GTEx vs others
- Within a tissue
- Within a tissue + sex
- Within a tissue + age range
- Within a tissue + sex + age range
Male vs female
- Within a tissue
- Within a tissue and age range
Age range vs others
- Within a tissue
- Within a tissue + sex

Figure 6. Schematic of sample groups used in new GTEx statistical comparisons. Comparisons were generated between groups defined along one or more axis: Male vs Female (X-axis), Tissue Detail (Y-axis) and age range (Z-axis).

Figure 7. In the analysis of sun-exposed skin, CXCL9 expression is significantly down-regulated for 20–29 year-old males vs other groups (top panel). Sample-level expression shows a trend of increased expression of CXCL9 in sun-exposed skin in older age groups (bottom panel).
In addition, 201 samples with Proteomics data (mass spectrometry) were integrated, allowing exploration and comparison of protein-level data.

Figure 8. CD44 (cell-surface adhesion receptor) RNA-seq expression vs protein detection across tissues in GTEx was plotted using the OmicSoft Studio function “RNA-seq Expresison=>MS integration”.
Processing pipeline and curation protocol changes
Changes to curation protocol: New AgeSummary metadata field
The AgeSummary field, which aggregates subject age-related information from multiple curated columns, has been added to relevant projects to aid discovery and visualization of age-related data.
- Age – Used whenever the source data contain multiple units in a single column
- Age[unit] – Used when the source data specify the time unit in the column header
- Age[days]
- Age[months]
- Age[weeks]
- Age[years]
- AgeRange – Used when age values are provided as ranges within a project; especially used for modelling of statistical comparisons between groups
- AgeRange[days]
- AgeRange[months]
- AgeRange[weeks]
- AgeRange[years]
OmicLands 2022R2 release notes
Reminder: Get the most out of your OmicSoft subscription
Invitation for you to request new data curation
The OmicSoft team invites requests for new OncoLand and DiseaseLand expression projects to curate for upcoming releases, as part of your subscription.
Let us know if there are important datasets that you would like to see curated and represented in the Lands. Public expression studies for Human, Mouse and Rat (GEO, SRA or Array Express) will be evaluated. Single-cell transcriptomic projects, projects for bulk RNA-seq and commercial expression arrays from Affymetrix, Illumina and Agilent are compatible platforms. Please email omicsoft.support@qiagen.com for more information.
We are also evaluating proteomics datasets for curation starting later this year.
Updated Land versions
OmicSoft continues to reprocess our most popular Land databases to move from Human genome B37 to Human genome B38 and Gencode Gene Model version 33. We recommend using the latest version (“B38_GC33”) when available, as this is where you’ll find the newest and most comprehensively curated data. Lands available in B38_GC33 include OncoHuman, GTEx, TCGA, Blueprint, CCLE, HumanDisease and TRACERx, in addition to the latest Single Cell Lands.
Flat file “text dumps”
If your subscription includes access to OmicSoft Land “text dump” flat file exports, you can request the latest data in the form of a series of indexed tab-delimited tables. These files are perfect for larger exploratory meta-analysis and ML studies. If you are interested in access to the latest data via flat file, ask your OmicSoft account administrator to request the links.
Oncoland Updates
OncoHuman updates

Figure 1. Distribution of samples added in the latest release of OncoHuman, grouped by Disease Category and Colored by Tissue Category.
This release of OncoHuman_B38_GC33 adds 2954 samples and 404 comparisons from 69 projects, including studies on:
- Central nervous system cancer, including pediatric cancers (glioblastoma, brain glioma, neuroblastoma, cerebellar medulloblastoma, diffuse intrinsic pontine glioma): GSE168457, GSE138863, GSE115873, GSE94035, GSE133014, GSE120920, GSE148389, GSE151343
- Gastrointestinal cancer (hepatocellular carcinoma, esophagus squamous cell carcinoma, hepatoblastoma, gallbladder carcinoma, pancreatic adenocarcinoma, pancreatic ductal carcinoma, pancreatic ductal adenocarcinoma): GSE134921, GSE104958, GSE44021, GSE81928, GSE78236, GSE56545, GSE140845, GSE82177, GSE122818, GSE135352, GSE100232, GSE51798, GSE114453, GSE144737, E-MTAB-6830
- Respiratory cancer, including advanced cancers (lung-large cell carcinoma, non-small-cell lung carcinoma, lung adenocarcinoma): GSE77209, GSE116679, GSE125864, GSE120622
- Hematologic cancer, including relapsed and refractory disease (B-cell childhood acute lymphoblastic leukemia, acute lymphocytic leukemia, large granular lymphocytic leukemia, T-cell prolymphocytic leukemia, acute myeloid leukemia): GSE156531, GSE181157, GSE162894, GSE13710, GSE7011, GSE7757, GSE19680, GSE12488, GSE137033, GSE147930, GSE85371, GSE153717, GSE140556, GSE72623, GSE77416, GSE79373, GSE79373, GSE81517, GSE81518
- Female reproductive cancer (ovarian cancer, breast cancer): GSE145374, GSE157737, GSE88847
As a reminder, all new oncology-focused project requests will be added to the integrated OncoHuman database, including hematology, pediatrics and metastatic data.

Figure 2. RNA-seq expression of key differentially expressed genes between genetic subtypes of pancreatic ductal adenocarcinoma, from study E-MTAB-6830. Pre-computed comparisons from this study were used to identify top differentially expressed genes; these genes were then searched to generate a Gene FPKM heatmap, sorted by the curated field GeneticSubType.
DiseaseLand Updates
HumanDisease updates

Figure 3. Distribution of samples added in the latest release of Human Disease, grouped by Disease Category and colored by Tissue Category.
This release of HumanDisease_B38_GC33 adds 7555 samples and 1293 comparisons from 99 project IDs, including studies on:
- Different types of immune cells from various tissues: GSE89577, GSE89576, GSE136625, GSE122409, GSE114812, GSE90569, GSE81098, GSE45720, GSE52129, GSE33424, GSE22025, GSE51133, GSE71566, GSE71575, GSE93857, GSE129852, GSE135467
- Immune-mediated diseases, including studies focusing on pediatric samples (inflammatory bowel disease, allergy, arthritis, systemic sclerosis, anti-neutrophil-cytoplasmic-antibody-associated vasculitis, dermatomyositis): GSE135170, GSE117875, GSE129752, GSE166861, GSE166863, GSE95772, GSE128314, GSE137276, GSE139334, GSE179153, GSE181549, GSE166924, GSE166925, GSE164918, GSE123141, GSE87465, GSE178460, GSE141631, GSE164213, GSE161426, GSE141934, GSE137344, GSE158952, GSE87466, GSE105074, GSE98820
- Gastrointestinal diseases (inflammatory bowel syndrome, liver disease, environmental enteric dysfunction): GSE166869, GSE168759, GSE36701, GSE63379, GSE164397, GSE159495, GSE164883, GSE146190
- Infectious disease (COVID-19, HIV): GSE161037, GSE160805, GSE166190, GSE153684, GSE172274, GSE167028
- Respiratory diseases (pulmonary fibrosis, asthma, chronic lung allograft dysfunction): GSE1081, GSE110021, GSE193150, GSE6095, GSE94557, GSE145505, GSE144033, GSE172367
- Ophthalmology (age-related macular degeneration): GSE180616, GSE155154, GSE156452, GSE129104, GSE159435
- Metabolic and endocrine diseases (obesity, type 1 diabetes): GSE164873, GSE168072, GSE162622, GSE156035, GSE176230, GSE181328, GSE189849
- Muscular diseases (Duchenne muscular dystrophy): GSE169190, GSE159273

Figure 4. Differential expression of 30 genes identified as being consistently differentially regulated between pairs of treatments in inflammatory bowel disease peripheral blood mononuclear cells (PBMCs) from GSE137680. Extensive pre-computed comparisons between groups of samples treated with various stimuli enable quick identification and refinement of signatures for treatments.
MouseDisease updates

Figure 5. Distribution of samples added to MouseDisease in the latest release, grouped by Disease State and colored by Tissue Category.
This release adds 774 samples and 1731 comparisons from 32 project IDs, including studies on:
- Aging: GSE139542, GSE139946, GSE140009, GSE141448
- Metabolic and endocrine diseases (obesity, type 2 diabetes, type 1 diabetes): GSE152576, GSE180490, GSE180493, GSE183247, GSE152937)
- Infectious diseases (West Nile fever): GSE123793
- Liver disease: GSE134466, GSE136821, GSE139992, GSE145242, GSE145243, GSE149863, GSE168069, GSE138602
- Kidney disease (diabetic nephropathy): GSE139987, GSE145301
RatDisease updates

Figure 6. Distribution of samples added to RatDisease in the latest release, grouped by Tissue Category and colored by Disease Category.
This release adds 264 samples and 98 comparisons from 17 project IDs, including studies on:
- Aging
- Cardiovascular diseases; atherosclerosis
- Metabolic and endocrine diseases; effect of fasting or food restriction
Stay tuned for our frequent trainings
Our Field Application Scientists routinely host online webinars on the basics of QIAGEN OmicSoft data exploration and advanced use cases to help you answer your scientific questions more quickly.
Browse upcoming webinars for OmicSoft and IPA.
Explore our extensive repository of webinars and video tutorials.
Have a topic of interest that you would love to see covered in a webinar? Email your requests to ts-bioinformatics@qiagen.com.
QIAGEN IPA/OmicSoft User Meetings
We’d love to meet you at our IPA and OmicSoft user meeting in Boston on September 22 and 23. Check out our registration page for more information and to save your spot.
We are currently planning an IPA and OmicSoft user meeting in London in October. Keep an eye out for your invitation to arrive next month, and reach out to your sales rep with questions or to express interest.
Review the full details of the OmicSoft 2022R2 release here.
Release notes on all past releases are found here.
Learn more about the QIAGEN OmicSoft portfolio here.
QIAGEN OmicSoft Lands 2022R1 Release Notes
Invitation to request new data curation
The OmicSoft team is now taking requests for new OncoLand and DiseaseLand expression projects to curate for upcoming releases, which will be included as part of your subscription.
Let us know if there are important datasets that you would like to see curated and represented in the Lands. Public (GEO, SRA and Array Express) expression studies for human, mouse and rat will be evaluated. Single-cell transcriptomic projects, projects for bulk RNA-seq and commercial expression arrays from Affymetrix, Illumina and Agilent are compatible platforms. Please contact us at omicsoft.support@qiagen.com for more information.
We are also evaluating proteomics datasets for curation starting later this year.
Updated Land versions
OmicSoft continues to reprocess our most popular Land databases for the move from Human genome B37 to Human genome B38 and Gencode Gene Model version 33. We recommend that you use the latest version ("B38_GC33") when available, as you will find the newest and most comprehensively curated data here. Lands available in B38_GC33 include OncoHuman, GTEx, TCGA, Blueprint, CCLE, HumanDisease and TRACERx, in addition to the latest Single Cell Land data.
Flat file "text dumps"
If your subscription includes access to OmicSoft Land "text dump" flat-file exports, you can request the latest data in the form of a series of indexed tab-delimited tables. These files are perfect for large exploratory meta-analyses and machine learning studies. If you are interested in accessing the latest data via flat files, ask your OmicSoft account administrator to request the links.
OncoLand Updates
OncoHuman_B38_GC33

Figure 1. New samples in OncoHuman, grouped by DiseaseState and colored by TissueCategory.
- 2022R1 is the first release of OncoHuman, our new Land that brings together solid cancer and hematology studies.
- All data are processed on B38_GC33 and feature several metadata changes.
- The 2022R1 content adds 73 projects and 1696 samples, in addition to the projects you would find in OncoGEO_B37.
Solid cancers
This release adds studies on cancers of the gastrointestinal system, central nervous system, prostate, breast, ovary, osteo-articular, head and neck as well as on melanoma.
The datasets explore the gene-expression profiling associated with the influence of tumor microenvironment, drug-induced gene modulation, tumor–nontumor paired samples, metastases, 3D cultures, organoids and xenograft models. Projects focusing on gene editing tools (CRISPR-Cas9) are also included.
Highlighted solid cancers studies
- Tumor micro-environment: GSE80333, GSE137245, GSE153713, GSE149327, GSE128405
- 3D culture: GSE148483 (cells cultured on patient-derived scaffolds), GSE147147 (exploring the brain tumor microenvironment in a reproducible and scalable system by developing a rapid three-dimensional bioprinting method), GSE155547 (the effect of platelets on the ovarian metastasis microenvironment in a 3D multicellular model of high-grade serous ovarian cancer)
- Paired tumor–nontumor samples: GSE147704 (comparative transcriptome analysis of endemic and epidemic Kaposi's sarcoma lesions), GSE105130
- CRISPR-Cas9: GSE141605, GSE148372, GSE163646
Hematology
Included in this release are studies that explore the gene-expression profiling associated with the mechanisms of action of immunomodulators in vitro, pre–post treatment paired samples and CRISPR-Cas9 genome editing as well as projects included in the online resource for interactive exploration of hematopoietic cancer data (Hemap).
Highlighted Hematology studies
- CRISPR-Cas9: GSE163817, GSE134173
- Paired pre–post treatment: GSE2842
- Hemap: GSE19681 (investigating the role of Hsa21-encoded miR-125b-2 in the pathogenesis of trisomy 21-associated megakaryoblastic leukemia), GSE2842, GSE10258, GSE7538, GSE18866, GSE9250, GSE12902, GSE8685, GSE8687, GSE11118
- In vitro immunotherapy studies: GSE8685, GSE8687
All projects added: GSE101209, GSE10258, GSE105083, GSE105130, GSE105439, GSE106272, GSE109319, GSE11118, GSE112221, GSE114326, GSE114856, GSE115853, GSE119688, GSE120647, GSE124189, GSE128405, GSE12902, GSE131792, GSE132215, GSE132233, GSE132624, GSE134173, GSE137245, GSE137528, GSE138581, GSE140077, GSE141116, GSE141444, GSE141605, GSE142719, GSE147147, GSE147704, GSE148372, GSE148444, GSE148483, GSE149327, GSE152312, GSE153713, GSE155547, GSE159493, GSE160401, GSE162945, GSE163639, GSE163646, GSE163817, GSE18832, GSE18866, GSE19681, GSE2842, GSE65867, GSE70926, GSE71519, GSE71520, GSE7538, GSE77314, GSE78025, GSE80333, GSE82110, GSE83479, GSE84023, GSE86518, GSE8685, GSE8687, GSE9250, GSE95499, GSE97098
ENCODE_RNAbinding
The Encyclopedia of DNA Elements (ENCODE) Consortium is an ongoing international collaboration of research groups funded by National Human Genome Research Institute (NHGRI). The goal of ENCODE is to build a comprehensive parts list of functional elements in the human genome, including elements that act at the protein and RNA levels as well as regulatory elements that control cells and circumstances in which a gene is active.
ENCODE_RNAbinding_B38_GC33 allows in-depth exploration of the splicing and gene-expression impacts of loss of hundreds of RNA- and DNA-associated genes, generated as part of the ENCODE Consortium.
This release contains RNA-seq experiments of 1122 samples (561 ENCODE experiments) for two popular cell lines (K562 and HEPG2) after shRNA knockdown targeting various proteins:
- RNA-binding proteins
- Transcription factors
- Cofactors
- DNA repair proteins
- Chromatin remodeler proteins
- RNA-polymerase complex
- DNA replication proteins
Key metadata columns for ENCODE_RNAbinding
- SampleID —GEO identifier associated with each sample; uniquely identifies each assayed sample
- CellLine — identifies each sample as being assayed in HepG2 or K562
- TargetCategory — categories of genes knocked down, such as "chromatin remodeler", "cofactor", "DNA replication", "RNA binding protein", "transcription factor"; useful for finding assays for functionally related genes.
- Transfection — identifies the specific gene that was knocked down (e.g., "FXR1 shRNA", "TRA2A shRNA") or "control shRNA"; useful for finding assays targeting individual genes. In most cases "control shRNA" should be included
Key visualizations
The Sample Distribution View displays the number of samples available. Default primary grouping is performed by TargetCategory (the functional class of the targeted gene).

Figure 2. Sample Distribution View of ENCODE_RNAbinding
After searching for a gene, the default visualization is the Gene FPKM View, which plots the expression of the specified gene in each assay. It may be useful to filter or trellis to plot one of two cell types (use CellLine: K562 or HEPG2) to see differences in expression in different knockdown experiments compared to control samples (TargetCategory: NA; Transfection: control shRNA).

Figure 3. Gene FPKM view in K562 cells treated by shRNAs, grouped by TargetCategory
Because many of these gene knockdowns affect splicing, the Transcript FPKM Views will frequently be useful. Use the Transcript FPKM (Individual Chart) View to see details of each transcript's measured FPKM per sample, or the Transcript FPKM (Multi-transcript Chart) to get an overview of average expression across groups.

Figure 4. Transcript FPKM View (Individual Chart) of one splice variant of NASP, before filtering and regrouping
At this point, you may want to focus on certain shRNAs or TargetCategories, such as "RNA binding proteins". Filter for (TargetCategory=RNA binding protein | NA), then set the Profile column to "Transfection" to visualize the details of which shRNA knockdowns led to significant down-regulation or up-regulation of specific transcript variants compared to control shRNA.

Figure 5. Transcript FPKM View (Individual Chart) of one splice variant of NASP, after filtering for TargetCategory="RNA binding protein" and "NA", and regrouping on "Transfection".
The Exon Junction Summary provides details of the relative usage of both Known and Novel detected exon junctions. Use the "ExonJunction" filters to select Known and/or Novel junctions. It may be helpful to filter according certain transfections, such as those that showed transcript-level differences

Figure 6. Exon Junction Summary View of control samples and two transfection experiments for factors that showed transcript-level differences for NASP.
DiseaseLand Updates
HumanDisease

Figure 7. New samples in HumanDisease, grouped by DiseaseCategory and colored by TissueCategory (Normal Control and Disease Control Samples are hidden).
This release of HumanDisease adds 5086 samples and 1169 comparisons from 99 unique project IDs.
Highlighted HumanDisease studies:
- Different T-cell types from various tissues: GSE133822, GSE159437, GSE22501
- NK cells: GSE116178, GSE154919, GSE165849, GSE158485, GSE89020
- Immune-mediated diseases (arthritis, pemphigus, psoriasis, dermatomyositis): GSE151897, GSE153015, GSE154474, GSE154988, GSE38064, GSE68689, GSE106893, GSE138746, GSE80785, E-MEXP-3890, GSE93776, GSE135004, GSE150954, GSE90152, E-MEXP-2681, GSE11971
- Muscular system (muscle-tissue profiling, physical exercise, muscular disease): GSE1300, GSE1295, GSE1295, GSE8441, GSE12648, GSE1017, GSE10760, GSE10760, E-TABM-206, GSE11686, GSE10685, GSE13070, GSE13205, GSE15090, GSE21164, GSE21496, GSE24235, GSE28998, GSE40645, GSE47881, GSE5110, GSE7014, GSE80
- Infectious disease: GSE12108, GSE13205, GSE119749, GSE13670, GSE9927, GSE11199
- Ophthalmology (eye-tissue profiling, eye disease): GSE29402, GSE58331, GSE71320, GSE89827, GSE89827
- Hemap collection: GSE12108, GSE13670, GSE5679, GSE7247, GSE7509, GSE8658, GSE8668, GSE4984, GSE7874, GSE9101, GSE13762, GSE9916, GSE11864, GSE22501, GSE9927, GSE11199
All projects added: E-MEXP-2681, E-MEXP-3890, E-TABM-206, GSE1017, GSE101988, GSE102737, GSE10361, GSE10685, GSE106893, GSE10760, GSE108350, GSE11199, GSE112594, GSE115112, GSE116178, GSE11686, GSE116899, GSE118106, GSE11864, GSE119501, GSE11971, GSE119749, GSE120226, GSE120502, GSE12108, GSE124284, GSE12648, GSE1295, GSE129921, GSE1300, GSE130038, GSE13070, GSE131503, GSE131527, GSE13205, GSE133822, GSE135004, GSE135251, GSE13670, GSE13762, GSE138734, GSE138746, GSE142206, GSE146028, GSE15090, GSE150954, GSE151875, GSE151897, GSE153015, GSE154474, GSE154919, GSE154988, GSE155322, GSE157840, GSE158485, GSE159437, GSE161549, GSE165849, GSE1724, GSE173808, GSE18583, GSE21164, GSE21496, GSE22501, GSE24235, GSE28998, GSE29402, GSE38064, GSE40645, GSE47881, GSE4984, GSE5110, GSE5679, GSE57178, GSE57662, GSE58331, GSE67427, GSE68689, GSE7014, GSE71320, GSE7247, GSE7509, GSE7874, GSE80, GSE80785, GSE8441, GSE85761, GSE8658, GSE8668, GSE89020, GSE89827, GSE90152, GSE9101, GSE93776, GSE9916, GSE9927, GSE99999, PRJNA512027, SRP151738
MouseDisease

Figure 8. New samples in MouseDisease, grouped by DiseaseState and colored by TissueCategory (Normal Control and Disease Control Samples are hidden).
This release adds 1556 samples and 782 comparisons from 49 projects.
Highlighted MouseDisease studies
- Aging: GSE110980, GSE110981,GSE110982, GSE110978, GSE110979, GSE117762, GSE117763, GSE57528, GSE56772, GSE57583
- Liver disease: GSE162863, GSE162869, GSE166488, GSE166867, GSE167032, GSE167034, GSE167033, GSE162276, GSE138778, GSE160020
- Endocrine and metabolic diseases (diabetes mellitus): GSE141782, GSE124394
- Kidney disease (diabetic nephropathy): GSE139987, GSE145301
All projects added: E-MTAB-8566, GSE104342, GSE106720, GSE109776, GSE110384, GSE110978, GSE110979, GSE110980, GSE110981, GSE110982, GSE112453, GSE113727, GSE113943, GSE116485, GSE117736, GSE117762, GSE117763, GSE121646, GSE124394, GSE124670, GSE133878, GSE138778, GSE139601, GSE139987, GSE141492, GSE141782, GSE144838, GSE145301, GSE145720, GSE155460, GSE156895, GSE158807, GSE160020, GSE160021, GSE162276, GSE162863, GSE162869, GSE166488, GSE166867, GSE167032, GSE167033, GSE167034, GSE167216, GSE169275, GSE179417, GSE56772, GSE57528, GSE57583, GSE84948
Single Cell Land Updates
To access the latest Single Cell Land data in your subscription, you must use at least OmicSoft Suite v11.6.
New Single Cell Protocol expands Landable projects
Starting with this release, a new set of "Lite" Lands are available (they have "Lite" in the title). These Lite Lands are comprised of UMI-based projects with cell-level cell-type annotations from authors, enabling OmicSoft curators to define cell clusters with exactly the same cells that the authors identified.
These project and sample metadata are still fully curated, and the ClusterCellTypes use the OmicSoft CellType ontology. The gene-expression values are extracted from the data submission matrix, OmicSoft defines the samples to be included in dimension reduction CellMaps, and the author cell annotations define the clusters.

Figure 9. More datasets can now be incorporated into the Single Cell Land framework with the new Lite protocol.
New single cell datasets of note

Figure 10. Millions of new cells from 40 new projects are available in Single Cell Land.
New datasets that may be of interest:
- Tabula sapiens, single-cell profiling of 24 organs
- NYSCF, iPSC-derived astrocytes
- Multiple datasets profiling breast cancers
- Profiling of pancreatic adenocarcinoma subtypes
Full list of projects added in this latest release: GSE106960, GSE123046, GSE126836, GSE127465, GSE138707, GSE139186, E-MTAB-6308, E-MTAB-8007, GSE101207, GSE108291, GSE110949, GSE117403, GSE117570, GSE119212, GSE124887, GSE124888, GSE125188, GSE129007, GSE129308, GSE132802, GSE137829, GSE138709, GSE138852, GSE139324, GSE140231, GSE142784, GSE145633, GSE150132, GSE151087, GSE153889, GSE154778, GSE157277, GSE162726, GSE92495, GSE97168, PRJCA001063, PRJEB39602, GSE114725, NYSCF, TabulaSapiens
Tabula sapiens (HumanUmiLite_B38_GC33) provides a great complement to Human Cell Landscape (HCL_B38) as an Cell Atlas across 24 subtypes.


Figure 11. Restricted expression of CD34 within lung tissue from Tabula Sapiens. CD34 is up-regulated in multiple identified endothelial cell types compared to other cells in the lung tissue (TabulaSapiens CellMap11). CD34 expression is visualized in a subset of cells (top panel), with curated ClusterCellType, indicating that these were a group of endothelial cells all within lung tissue (middle panel). Statistical comparisons pre-computed for each cluster against other clusters in CellMap 11 reveal up-regulation of curated endothelial cell types vs others (bottom panel).
Another cell profiling project of interest is GSE116470, which profiles nine different brain regions from adult mice, allowing detailed exploration of expression variability in the central nervous system.
![]()
Figure 12. Expression of Sox2 in astrocytes (light blue, top panels), hippocampus (left panels) and frontal cortex (right panels) of profiled mouse brains (GSE116470).
Did you know?
OmicSoft Lands include over 118,000 statistical comparisons based on our modeling of the curated data. Sometimes these contrasts are simple, with only one factor in the model. A more complex model is created in other cases, with two, three or more covariates included in the model!
The "ComparisonContrast" field reflects these complex models for the contrast with this syntax:
Controlled Factor 1: Controlled Factor 2: Contrasted Factor 3=> Controlled Level 1:Controlled Level 2→ Case vs Control for Factor 3
For example:
TreatmentStatus:Response:TreatmentHistory => nivolumab:no response -> ipilimumab vs none

Figure 13. Expression of DAZ2 in GSE91061, grouped by TreatmentStatus+Response+Treatment History. Samples included in Comparison contrast of TreatmentHistory:ipilimumab vs none in TreatmentStatus:nivolumab and Response:none colored blue.
QIAGEN OmicSoft Lands 2021R4 Release Notes
Invitation to request new data curations
The QIAGEN OmicSoft Team invites you to request new OncoLand, DiseaseLand and Single Cell Land expression projects to be curated for upcoming releases, which will be included as part of your subscription.
Let us know if there are important datasets that you would like to have curated and represented in the Lands. Public (GEO, SRA and Array Express) expression studies for human, mouse and rat will be evaluated; single-cell transcriptomic projects, projects for bulk RNA-seq and commercial expression arrays from Affymetrix, Illumina and Agilent are compatible platforms. Contact us at omicsoft.support@qiagen.com for more information.
We are also evaluating proteomics datasets for curation starting later this year.
Updated Land versions
The QIAGEN OmicSoft Team continues to reprocess our most popular Land databases to move from human genome B37 to human genome B38 and Gencode Gene Model version 33. We recommend that you use the latest version (“B38_GC33”) as soon as it becomes available, as this version contains the newest and most comprehensively curated data.
Lands available in B38_GC33 include GTEx, TCGA, Blueprint, CCLE, HumanDisease and TRACERx, in addition to the latest Single Cell Lands. Upcoming B38_GC33 Lands include OncoGEO and TARGET.
Flat-file “text dumps”
If your subscription includes access to QIAGEN OmicSoft Land “text dump” flat-file exports, you can request the latest data in the form of a series of indexed, tab-delimited tables. These files are perfect for larger exploratory meta-analysis and machine learning studies. If you are interested in accessing the latest data via flat file, ask your QIAGEN OmicSoft account administrator to request the links.
OncoLand updates
New projects were added to OncoGEO (including Cancer Moonshot consortium projects) and Hematology, and a comprehensive update of CCLE metadata was performed. In the next release, OncoGEO will be available on human genome B38/GenCode.33.
CCLE Land
The latest release of CCLE Land includes hundreds of new samples, new data types and extensive new curated metadata fields sourced from DepMap and other sources.

Figure 1. CCLE Cell Lines, grouped on the Y-axis by DiseaseCategory and subgrouped by CancerType.
The 2021R4 release of CCLE_B38_GC33 increases the number of cell lines profiled from 1114 to 1805 cell lines, corresponding to the 2021R3 DepMap release. All data use Human.B38 and OmicSoft Gencode.V33 as the reference genome and gene model.
The QIAGEN OmicSoft Team of scientists spent over 1300 hours reviewing the latest available data from over 40 publications and applied our curation standards to standardize the newest information about cell-line origins and features. New metadata fields have clearly explained ToolTips to describe the purpose of the field. Download the full dictionary here: https://resources.omicsoft.com/downloads/land/CCLE/CCLE_B38_GC33_2021R4_Updates.xlsx
Key columns, such as DiseaseState, are updated to the latest OmicSoft controlled vocabularies and standards that have been used in other QIAGEN OmicSoft Lands. These standards are based on the curation of information from DepMap, CCLE publications, and original papers. Additional metadata columns can be harnessed to select general cancer types or specific histological types.
- DiseaseState uses OmicSoft controlled-vocabulary terms to describe cell lines as one of 29 cancer disease states or “control”.
- CancerType (disease subtype) and CancerClassification (for histological types) provide additional curated disease information.
Tissue and DiseaseLocation[PrimarySite] were added to reflect the best current information about the tissue of origin for each cell line.
Finally, CancerType[Cellosaurus] captures the disease classification of these cell lines from Cellosaurus – Expasy, which reflects the observed discrepancies between various sources.
Two comment fields (Comment and Comment[PMID22460905]) provide additional free-text notes from QIAGEN OmicSoft curators that were added during the review process.
Important note: With the latest update, cell lines now use DepMapID instead of the deprecated CCLE ID as SampleID. DepMapID has been adopted by Cellosaurus and other resources for easier cross-reference.
OncoGEO Land updates
This release adds 9666 new samples and 408 new comparisons from 54 projects (54 unique project IDs), focusing on prostate, lung, breast, gastrointestinal system, thyroid, pancreas, kidney, melanoma, lung and central nervous system cancers.
This release encompasses studies that explore gene expression profiles associated with drug-induced gene modulation, patient outcome, tumor/non-tumor paired samples, metastases and organoids, or that focus on alternative splicing. The release also includes studies that investigate gene signatures as a prognostic factor and insights into the tumor micro-environment.

Figure 2. Distribution of samples by DiseaseState in OncoGEO 2021R4.
Highlighted OncoGEO projects:
- Drug screening on NCI60 cell panel: GSE116438, GSE116439, GSE116440, GSE116441, GSE116442, GSE116443, GSE116444, GSE116445, GSE116446, GSE116447, GSE116448, GSE116451, GSE116449, GSE116450
To select these projects, use “NCI60 cell panel;drug screening” as keywords. - Paired tumor-/non-tumor samples: GSE149609, GSE58561, GSE117230, GSE151165, GSE5364, GSE162102
- Tumor micro-environment: GSE101665, GSE123375, GSE117230
- Gene signatures for prognosis accuracy improvement: GSE17891, GSE85047, GSE107850, GSE157009, GSE157010, GSE109857, GSE31519
- Cancer Moonshot: GSE114052, GSE116728, GSE120720, GSE121217, GSE123860, GSE126917, GSE134147, GSE139335, GSE139962, GSE141633, GSE144319, GSE147976, GSE149609, GSE164141, GSE97398
To identify Cancer Moonshot projects, one of the following keywords can be used: “Cancer Moonshot”, “Adult Immunotherapy Network”, “Immuno-Oncology Translational Network”, “IOTN”) - Other new projects: E-MTAB-8412, GSE112037, GSE142102, GSE152395, GSE162436, GSE163986, GSE166991, GSE167025, GSE169321, GSE60979, GSE67742

Figure 3. Find Cancer Moonshot consortium projects using the Project-level “Keywords” filter.
Hematology Land
This release adds 2291 new samples and 226 new comparisons from 19 projects (17 unique project IDs), focusing on leukemia and different subtypes of lymphoma.
Included in this release are studies that explore the gene expression profiling associated with the mechanisms of action of certain drugs in vitro, pre-post treatment paired samples, CAR-T cell therapy and CRISPR-Cas9 genome editing.

Figure 4. New samples in Hematology Land profiled by DiseaseState, sub-grouped by Project ID. A large number of projects focusing on DLBCL were added to this release.
Highlighted Hematology projects:
- CRISPR-Cas9: GSE127266, GSE158303
- Drug resistance mechanism: GSE138126
- Molecular subtypes for a large DLBCL cohort: GSE181063
- Other projects this release: CRA000746, GSE127761, GSE132929, GSE134480, GSE138282, GSE151612, GSE159472, GSE159852, GSE160608, GSE160609, GSE56313, GSE56314, GSE57611
DiseaseLand updates
HumanDisease

Figure 5. New samples in HumanDisease, grouped by DiseaseState and colored by TissueCategory (Normal Control and Disease Control samples are hidden).
This release adds 2651 new samples and 1404 comparisons from 80 projects (79 unique project IDs).
This release includes studies on the following:
- T-cell types from various tissues (easily found with string filter “T cell” in CellType): GSE102751, GSE112899, GSE126116, GSE132790, GSE132932, GSE133397, GSE135291, GSE135390, GSE136200, GSE141508, GSE148970, GSE150805, GSE151586, GSE152381, GSE158489, GSE163405, GSE163605, GSE166375, GSE166445, GSE166866, GSE169009, GSE169761, GSE173377, GSE176191
- Type 1 diabetes mellitus: GSE131526
- Aging (muscular tissue): GSE113165, GSE164471, GSE25941, GSE28392, GSE28422
- Arthritis: GSE111357, GSE114007, GSE123492, GSE169077, GSE171952, PRJNA505578
- Nervous system diseases (Parkinson’s disease and multiple sclerosis): GSE111972, GSE123496, GSE138614, GSE20333, GSE68719
- Retina profiling: E-MTAB-4377, GSE60570, GSE71831,PRJNA232850, PRJNA274213, PRJNA298886
- Profiling of gene expression in 30 brain regions : GSE127898
- Other studies: E-MTAB-5965, GSE109439, GSE114519, GSE120847, GSE124381, GSE124474, GSE131089, GSE131523, GSE131524, GSE132044, GSE132931, GSE134881, GSE137869, GSE150540, GSE151086, GSE151924, GSE155176, GSE157652, GSE158395, GSE159266, GSE160016, GSE165498, GSE172100, GSE173895, GSE37686, GSE65469, GSE83443, GSE83482, GSE84639, GSE93801, PRJNA284254
MouseDisease

Figure 6. New samples in MouseDisease, grouped by DiseaseState and colored by Tissue (Normal Control and Disease Control samples are hidden).
This release adds 1750 new samples and 1678 comparisons from 45 projects and includes studies of the following:
- Aging: GSE120290, GSE122061
- Liver disease: GSE138779, GSE153703, GSE154021,GSE154724
- Cardiovascular disease (including aortic dissection): GSE138484, GSE138558, GSE147078
- Endocrine and metabolic diseases (including obesity and diabetes mellitus): GSE120290, GSE122061, GSE125637, GSE133577, GSE136582, GSE138779, GSE139440, GSE141826, GSE142874, GSE144829, GSE145404, GSE145620, GSE147039, GSE149231, GSE150485, GSE151268, GSE152539, GSE153703, GSE154021, GSE154325, GSE154611, GSE154724, GSE156838, GSE172283
- Infectious disease (bacterial and viral): GSE124688, GSE140943, GSE140944, GSE149425, GSE150664
- Nervous system diseases: GSE132044, GSE144459, GSE147039, GSE152539, GSE156646, GSE79812
- Potential biomarkers of vaccine inflammation in mice: GSE120661
- Other projects: GSE123124, GSE135844, GSE151303, GSE155892, GSE158057, GSE159207, GSE167248, GSE99701
Did you know?
QIAGEN OmicSoft Studio includes powerful functions for importing and exploring “measurement data”, quantitative data for samples in Lands.
For CCLE Land, extensive data (drug sensitivity, metabolomics, proteomics) from studies performed on cancer cell lines can be added and analyzed alongside CCLE 'omics data, including the following:
- Cancer Therapeutics Response Portal: https://portals.broadinstitute.org/ctrp/
- Cancer Target Discovery and Development: https://ocg.cancer.gov/programs/ctd2/data-portal/
- Genomics of Drug Sensitivity in Cancer (CancerRxGene): https://www.cancerrxgene.org/
- Your own quantitative measurements of any CCLE Cell lines
Adding new measurement data is pretty simple, but new data can only be added by an OmicSoft Server administrator.
If you use CCLE Land but don’t see measurement data, talk to your administrator and review this wiki page for information: http://www.arrayserver.com/wiki/index.php?title=Manage_Measurement_Data_in_ArrayLand.
In case you missed it: Major TCGA Update
We recently released a major update to TCGA Land. With this update, we released the TCGA metadata dictionary, a lookup guide that you may find useful. This is available in both pdf and xlsx formats. Please find the links and explanation about the utility in the whitepaper titled: Navigating TCGA metadata
2021R3 Land Release Notes
In this content release, OncoLand and DiseaseLand added hundreds of new projects, and Human Disease data are now available on Human Genome B38!
If you don't see a Land of interest listed under "Select Land", please ask your OmicSoft Server administrator to check the Cloud Land Publishing function for available data.
Invitation to request new data curation
The OmicSoft team is inviting requests for new OncoLand or DiseaseLand expression projects to curate for upcoming releases, which will be included as part of your subscription.
Let us know if there are important datasets that you would like to see curated and represented in the Lands. Public (GEO, SRA or Array Express) expression studies for human, mouse, and rat will be evaluated; single-cell transcriptomic projects, projects for bulk RNA-seq and commercial expression arrays from Affymetrix, Illumina and Agilent are compatible platforms. Please email omicsoft.support@qiagen.com for more information.
OncoLand

Figure 1. Distribution of disease samples in OncoGEO and Hematology update by Disease Category.
OncoGEO
This release adds 2058 new samples and 399 new comparisons from 63 projects, focusing on breast, melanoma, lung, central nervous system and stomach cancer.
Some highlights in this release are studies that explore the following:
- CAR-T cells: GSE164902 (SynNotch CAR-T cells), GSE163400, GSE136432, GSE135379, GSE161942, GSE158144
- Paired pre- and post-treatment, and tumor and non-tumor samples: GSE155164, GSE106128, GSE144020, GSE94104, GSE110114, GSE133039
- Gene signatures for prognosis accuracy improvement: GSE33331, GSE126870, GSE168009, GSE133713, GSE131769, GSE139050, GSE122220, GSE126044, GSE135565
- Cancer progression: GSE80609, GSE144020
- Xenograft models: GSE66346, GSE148310, GSE100066, GSE104020, GSE100669
- And more!
Hematology
This release adds 1830 new samples from 44 unique project IDs with 222 comparisons, focusing on subtypes of leukemia, lymphoma and myeloma.
Some highlights in this release are studies that explore the following:
- CAR-T cells: GSE134937, GSE153437 (axicabtagene ciloleucel), GSE156190, GSE166976 (NK cell), GSE160311 (synthetic T cell antigen receptor (STAR)), GSE147046, GSE156207
- Paired pre- and post-treatment samples: GSE122934, GSE75086, GSE117090
- Xenograft models: GSE123485, GSE75086, GSE156207, GSE121007
TCGA major update coming soon

Figure 2. The comprehensive update of TCGA metadata included the review of over 1200 files, the definition of over 1000 fields, the unification and grouping of hundreds of columns, the update of fields representing TCGA publication results and the curation of hundreds of treatment labels.
We are in the final stages of a comprehensive update of TCGA Land (TCGA_B38_GC33).
Look for comprehensive metadata field definitions and tooltips, improved metadata field names, curated treatment information, additional marker paper and PanCanAtlas cluster information, and more!
DiseaseLand

Figure 3. Distribution of disease samples in the latest release of DiseaseLand by Disease Category.
HumanDisease
With this release the Human Disease collection is now available on Human Genome B38/GenCode version 33. All new content requests will be added to HumanDisease_B38_GC33.
If you don't see HumanDisease_B38_GC33, be sure to ask your OmicSoft Server administrator to use "Publish Cloud Land" to select the new Land.
This release adds 7749 new samples and 2297 comparisons from 102 unique project IDs.
This release includes the following:
- NK cells (CellType: NK Cell) from peripheral blood, umbilical cord blood, lung, liver, spleen and more
- Infectious diseases and vaccines: over 30 projects in the “Infectious Diseases” Therapeutic Area
- Arthritis: E-MTAB-6266, E-MTAB-7466, GSE104113, GSE148395, GSE41038, GSE49604, GSE57218, GSE75181, GSE89484, GSE98918
- Female reproductive diseases: GSE35287, GSE40400, GSE5850
- Nervous system diseases: GSE121569, GSE122647, GSE135511, GSE136666, GSE137619, GSE138064, GSE141381, GSE150174, GSE151936, GSE22779
- Tissue-profiling projects: GSE2004; GSE2361; GSE803
MouseDisease
This release adds 1200 new samples and 357 comparisons from 59 projects, including studies on the following:
- Kidney disease: 13 new projects in Therapeutic Area “Renal Disease”, including chronic kidney disease, acute kidney injury and renal fibrosis
- Liver disease: NAFLD, acute liver failure and acute liver injury models in projects such as GSE102489, GSE104302, GSE111828, GSE120484, GSE124694, GSE128284, GSE130528 and GSE132298
- Arthritis: E-MTAB-5326, GSE101573, GSE104793, GSE104794, GSE33754, GSE43663, and GES53857
- Nervous system diseases (migraine, anxiety, addiction, obsessive compulsive disorder, amyotrophic lateral sclerosis): 14 new projects in Therapeutic Area “Neurology” and “Psychiatry”
- Systemic lupus erythematosus: GSE128692, GSE145422, and GSE147359
- Drug screen: GSE110256
RatDisease
This release adds 383 new samples and 125 comparisons from 13 projects on nervous system disease, cardiovascular and metabolic diseases and aging.
Single Cell Lands
With the latest Single Cell Lands content update, new datasets on ophthalmology, oncology, neurology, gastroenterology, endocrinology, dermatology and more are now available.
- 29 human projects (23 UMI + 6 non-UMI), 79 datasets and 801 comparisons
- 9 mouse projects (8 UMI + 1 non-UMI), 15 datasets and 166 comparisons

Figure 4. Human UMI datasets in the latest release, plotting the number of cell clusters with different cell types (colored) by tissue.
Looking ahead to the next release, expect 55 additional projects with 96 "cell map" dimension reduction datasets, profiling 3.2 million cells from 847 samples.
Our new "Single Cell Lite" protocol for integrating pre-quantified datasets with full manual curation enables us to bring in datasets without raw data. Key datasets to be integrated include Tabula Sapiens (UMI and nonUMI) profiling normal tissue expression in humans, and Allen Mouse Brain Atlas (GSE116470).
Did you know?
In OmicSoft curation, we annotate in vivo and in vitro treatment studies in different columns.
- Treatment: For in vitro studies, describes the treatment performed on a sample, using OmicSoft controlled vocabularies
- Subject Treatment: For in vivo studies, describes the treatment using OmicSoft controlled vocabularies
- If the same subject was sampled before and after treatment, Subject Treatment will be the same, but Treatment Status will indicate which sample is post-treatment
- Treatment Status: Indicates the treatment applied to an individual sample, when the sample came from a Subject (i.e., patient) that was sampled pre- and post-treatment
- Pre Treatment: treatment given in vivo or in vitro before the main treatment. Many times the pre-treatment is the disease-induction model for mouse studies.
- Maternal Treatment: in vivo treatment given to the mother prior to or during gestation. The sample collected from is from the offspring.
OmicSoft curates controlled vocabulary terms from PubChem, NCIT, DrugBank, ChemSpider and the company web site of the treatment source.
Using the SubjectTreatment and TreatmentStatus columns, you can group and subset in vivo treatment studies to reveal interesting patterns in the data, for example, by showing pre-treatment gene expression between patients with differential response to a treatment.

Figure 5. KCNB2 is up-regulated in pre- and post-treatment samples of pancreatic ductal adenocarcinoma from GSE131050. All samples are curated as SubjectTreatment=5-fluorouracil;irinotecan;leucovorin;oxaliplatin;PF-4136309. Pre-treatment samples are identified by TreatmentStatus=none, post-treatment samples are identified by TreatmentStatus=5-fluorouracil;irinotecan;leucovorin;oxaliplatin;PF-4136309. Treatment response is indicated by Response (partial response or stable disease).
2021R2 Land Release Notes
In this content release, OncoLand and DiseaseLand added hundreds of new projects.
If you don't see a Land of interest listed under "Select Land", please ask your OmicSoft Server administrator to check the Cloud Land Publishing function for available data.
Invitation to request new data curation
The OmicSoft team is inviting requests for new OncoLand or DiseaseLand expression projects to curate for upcoming releases, which will be included as part of your subscription.
Let us know if there are important datasets that you would like to see curated and represented in the Lands. Public (GEO, SRA or Array Express) expression studies for human, mouse and rat will be evaluated; single-cell transcriptomic projects, projects for bulk RNA-seq and commercial expression arrays from Affymetrix, Illumina and Agilent are compatible platforms. Please email omicsoft.support@qiagen.com for more information.
BodyMaps
Tissue-specific comparisons from GTEx
GTEx_B38_GC33 now has comparisons revealing the top up- and down-regulated genes for 52 tissues.

Figure 1. Search for a gene and see in which tissues it is enriched; use “Specify Profile Columns” to change to Case.tissueDetail_GTEx or similar, color by Case.TissueCategory.

Figure 2. Discover co-enriched genes with the Comparison Correlation View to find additional genes that are enriched or depleted in a similar pattern as your gene of interest.

Figure 3. Browse and filter the comparisons to find the most up- and down-regulated genes (the top genes are so significant that they are compressed to the top)
OncoGEO

Figure 4. Distribution of new oncology-focused samples in OncoGEO 2021R2, grouped on the Y-axis by Tissue and colored by DiseaseState.
This release adds 5246 new samples and 598 new comparisons from 106 projects, focusing on melanomas, breast, liver and pancreatic cancers. Included in this release are studies that explore the gene expression profiling associated with the mechanisms of action of various drugs both in vivo and in vitro, pre- vs. post-treatment paired samples, tumor vs. non-tumor paired samples, potential biomarkers and gene signatures that could predict patient outcome, xenograft models and drug resistance.
Highlighted OncoGEO projects:
- Paired tumor and non-tumor samples: E-MTAB-1503, GSE104310, GSE117361, GSE136247, GSE36376, GSE36411, GSE57957, GSE76427, GSE98383, GSE98617, E-MTAB-6389, GSE100684, GSE127559, GSE138485, GSE171485, GSE22780, GSE41368, GSE43795, GSE56560, GSE71989, GSE126076
- Paired pre- and post-treatment samples: GSE87455, GSE131050
- In vivo applied treatments: GSE102723, GSE128515, GSE131050, GSE153262, GSE60646, GSE87455
- In vitro applied treatments: GSE133568, GSE127760, GSE155570, GSE119832, GSE102744, GSE123250, GSE163950, GSE136613, GSE136614, GSE100269, GSE127948, GSE95189, GSE68836, GSE100169, GSE146850
- Xenograft models: GSE128515, GSE1099030
- Gene signatures and potential biomarkers for prognosis accuracy improvement: GSE131050, GSE138485, GSE158309, GSE39409, GSE57495, GSE62165, GSE76427, GSE77435, GSE84219, GSE104580
- Tumor-educated platelet (TEP) characterization: GSE160252
- Purity Independent Subtyping of Tumors (PurIST), a clinically robust single-sample classifier for tumor subtyping in pancreatic cancer: GSE131050
Hematology

Figure 5. Distribution of new hematologic cancer-focused samples in Hematology 2021R2, grouped on the Y-axis by DiseaseState and colored by CellType.
This release adds 1231 new samples and 364 new comparisons from 30 projects, focusing on different subtypes of lymphoma and leukemia, the most highly represented subtypes are acute myeloid leukemia (LAML) followed by acute lymphoblastic leukemia (ALL) and chronic myeloid leukemia (CML). Included in this release are studies that explore the mechanisms of action of certain drugs both in vivo and in vitro and discovery of potential biomarkers and gene signatures that could predict drug resistance.
Highlighted Hematology projects:
- Gene fusions and alternative splicing events in hematologic cancers: GSE139620, GSE139621
- Gene signatures and potential biomarkers for treatment-response prediction: GSE103424, GSE130404, GSE143166
- Insights on drug mechanisms of action: GSE139620, GSE139617, GSE139618, GSE149624, GSE138322, GSE125437
- Paired pre- vs. post-treatment samples: GSE136634
HumanDisease

Figure 6. Distribution of new Disease-focused samples in HumanDisease 2021R2, grouped on the Y-axis by DiseaseState and colored by Tissue. Normal control and Disease Control samples were hidden.
This release adds 15,358 new samples and 2099 comparisons from 126 projects, including a collection of studies on immune mediated diseases (systemic lupus erythematosus, Sjogren’s syndrome, psoriasis and others), amyotrophic lateral sclerosis, obesity, as well as new studies on respiratory diseases, infectious diseases, muscular dystrophy and nervous system diseases.
Highlighted HumanDisease projects
- Tissue profiling for transplanted organs (kidney; heart): GSE124203; GSE124897
- Leukocyte subsets from different immune-mediated conditions: E-MTAB-2713
MouseDisease

Figure 7. Distribution of new Disease model samples in MouseDisease 2021R2, grouped on the Y-axis by DiseaseState and colored by Tissue.
This release adds 1589 new samples and 1413 comparisons from 28 projects on vaccines, degenerative diseases of the CNS, aging, metabolic and immune mediated diseases.
Highlighted MouseDisease projects
- Vaccines: GSE100288; GSE107116; GSE107543; GSE129133; GSE131914; GSE143617
Single Cell Lands
With the latest Single Cell Lands content update, new datasets on ophthalmology, oncology, neurology, gastroenterology, endocrinology, dermatology and more are now available.
- 29 human projects (23 UMI + 6 non-UMI), 79 datasets and 801 comparisons
- 9 mouse projects (8 UMI + 1 non-UMI), 15 datasets and 166 comparisons

Figure 8. Human UMI datasets in 2021R2, plotting the number of clusters with different cell types (colored) by tissue.

Figure 9. Human UMI datasets in 2021R2, plotting the number of clusters with different cell types (colored) by tissue.

Figure 10. Mouse UMI datasets in 2021R2, plotting the number of clusters with different cell types (colored) by tissue.

Figure 11. Mouse non-UMI datasets in 2021R2, plotting the number of clusters with different cell types (colored) by tissue.
2021R1 Land Release Notes
With this content release, QIAGEN OncoLand and QIAGEN DiseaseLand provide hundreds of new projects. If you don't see a Land of interest listed under "Select Land", please ask your QIAGEN OmicSoft Server administrator to check the
In case you missed it
OmicSoft is in the process of re-analyzing all of our Human Lands on Human.B38 genome and the OmicsoftGenCode.V33 model. Several reprocessed Lands have been released, and the most up-to-date versions of the relevant Lands can be identified by the B38_GC33 suffix. Updated Lands include Blueprint_B38_GC33, CCLE_B38_GC33, GTEx_B38_GC33, TCGA_B38_GC33 and TRACERx_B38_GC33, as well as the controlled-access DLBCL_NCI_B38_GC33 Land.
QIAGEN OncoLand highlights
TCGA_B38_GC33
TCGA is now available based on alignment to GenCodeV33. With this Land, you can now build the latest VirtualLands, such as the popular CCLE.GTEx.TCGA VirtualLands. Later this year, we will update the extensive TCGA metadata to TCGA_B38_GC33, as well as comparisons between tumor samples that have key mutations in oncogenes and tumor suppressor genes vs samples that do not have these key mutations.

Figure 1. BMP2 expression in tissue samples from CCLE, GTEx and TCGA, using the latest Human.B38/Gencode.V33 releases. The Y-axis is profiled on Tissue Category, SourceLand and Tumor or Normal.
OncoGEO
In this release, we added 6591 new samples and 618 comparisons from 99 projects, with a focus on GI, reproductive and male urogenital cancers. Included in these are samples from studies of gene expression characterization of metastatic lesions (in which some cases are paired with primary tumors), pre- and post-treatment paired samples, explorations of the prognostic value of particular gene signatures, the effects of established treatments, comparisons of alternate therapeutic strategies and drug resistance.
Highlighted OncoGEO projects
- Metastasis-specific gene expression profiles reflected in clinical, in vitro and in vivo experiments (GSE58708, GSE61723, GSE125989, GSE100534, GSE62837, GSE98281, GSE119968, GSE147043, GSE134405, GSE73652, GSE156178)
- Gene classifiers and potential biomarkers for prognosis accuracy improvement (GSE147493, GSE141551, GSE148700, GSE143224, GSE109169, GSE102484)
- In vitro and xenograft models (GSE101799, GSE101742, GSE137842, GSE138248, GSE134405, GSE146661)
- Circulating tumor cells and their survival mechanisms (GSE153514, GSE144561, GSE144561, GSE140131, GSE111842, GSE150624)
- Insights into disease progression in the context of drug resistance (GSE153470, GSE107040, GSE149723, GSE149724, GSE110948, GSE102124, GSE144248)
- Pre- and post-treatment paired samples (GSE144794, GSE111177, GSE141484)

Figure 2. Distribution of new oncology-focused samples in OncoGEO 2021R1, grouped on the Y-axis by Tissue and color-coded according to DiseaseState.
Hematology
With 1303 new samples and 250 comparisons from 54 projects, this release adds Hodgkin and non-Hodgkin lymphoma, leukemia and myeloma samples, with experiments that explore the mechanisms of action of specific drugs, the discovery of potential biomarkers and the gene signatures that could predict patient outcome.
Highlighted Hematology projects
- Potential biomarkers identified in transfection experiments (GSE13888, GSE25987, GSE22036, GSE14746, GSE20229)
- Gene signatures for treatment-outcome prediction and disease classification (GSE17920, GSE22759, GSE14834, GSE148715)
- Insights into drug mechanisms of action (GSE118558, GSE103143, GSE14834, GSE81267, GSE152497)
- Gene fusions and alternative splicing events in hematologic cancers (GSE139614, GSE139616, GSE139619, GSE143986)

Figure 3. Distribution of new hematologic cancer-focused samples in Hematology 2021R1, grouped on the Y-axis by DiseaseState and color coded by CellType.
QIAGEN DiseaseLand highlights
This release contains datasets exploring the following: obesity, diabetes, immune-mediated diseases, vaccines (transcriptional response induced by influenza, BCG and Hantavirus vaccines in human and mouse) and vaccine adjuvants, viral and bacterial diseases, cellular-stress response and compound profiling (including genotoxicity studies). We've also added several profiling studies of the eye (cornea and retina).
HumanDisease
This release adds 3969 new samples and 949 comparisons from 108 projects, including a collection of studies on Zika virus and detailed profiling of eye expression, as well as new studies on cardiovascular, musculoskeletal and nervous system diseases.
Highlighted HumanDisease projects
- Zika infection (GSE135413, GSE139181, GSE133396, GSE81637, GSE146423, GSE125554, GSE129882, GSE113636, GSE118305, GSE123835, GSE105884, GSE149775)
- Eye profiling (GSE36695, GSE36695, GSE40524, GSE41616, GSE65991, GSE67645)

Figure 4. Distribution of new disease-focused samples in HumanDisease 2021R1, grouped on the Y-axis by DiseaseState and color coded by Tissue. Normal Control and Disease Control samples were hidden.
MouseDisease
This release adds 1559 new samples and 543 comparisons from 52 projects, with a focus on cellular stress in normal tissues and cells (GSE118660, GSE35681, GSE49598, GSE700, GSE84450, GSE90070, GSE54581, GSE29929, GSE11496, GSE11684, GSE122507).

Figure 5. Distribution of new disease-model samples in MouseDisease 2021R1, grouped on the Y-axis by DiseaseState and color coded by Tissue. Normal Control and Disease Control samples were hidden.
RatDisease
This release adds 2617 new samples and 2329 comparisons from 14 projects that focus on in vivo (SubjectTreatment metadata) and in vitro (Treatment metadata) compound-profiling and toxicity studies: GSE119122, GSE119129, GSE119133, GSE144219, GSE119933, GSE144219, GSE129814, GSE122184.

Figure 6. Subset of the distribution of new in vivo compound-profiling or toxicity samples, which are grouped on the Y-axis by SubjectTreatment.

Figure 7. Distribution of new in vitro compound-profiling or toxicity samples, grouped on the Y-axis by Treatment.
Did you know?
In addition to the unparalleled collection of normal tissue and blood expression data that can be found in GTEx and Blueprint, HumanDisease, MouseDisease, and RatDisease contain thousands of Normal Control samples from other tissue-profiling projects (i.e., projects not focused on comparing disease vs normal). These projects provide a complement for tissues (including fetal tissues) that are not covered by GTEx or Blueprint and that focus on precise definitions of samples.
To find these projects, use the Project filter tab Disease and select "Normal Control", which will include only studies that are focused on normal tissues.
If you don't select for "Normal Control" projects, Normal Control samples will be returned from thousands of additional studies that included both disease and normal tissues.
Subsequently, you can filter out any remaining disease samples with the Sample filter tab "Disease", selecting "Normal Control" (you can include "Disease Control" as well). Learn more about the difference between Normal Control and Disease Control.
At this point, you will probably want to group by Tissue to see the available tissues, and use the Sample level filter "TissueCategory" to hide hematopoietic and lymphoid system samples.
Finally, select the sample-level Treatment filter to "No Info" and "None", to eliminate samples that were treated.
To quickly apply these filters the next time you want to explore normal tissues, be sure to save this combination of filters by clicking “Manage Filters”.

Figure 8. Save your filters to quickly apply them in future sessions.
After applying these filters (or your saved filter set), you can perform searches to explore patterns of expression across diverse normal tissue samples.

Figure 9. Microarray expression of SerpinB6 across samples from Normal Control projects.
2020R4 Land Release Notes
In this content release, OncoLand and DiseaseLand added hundreds of new projects. If you don't see a Land of interest listed under "Select Land", please ask your OmicSoft Server administrator to check the Cloud Land Publishing function for available data.
In Case You Missed It
The latest versions of OmicSoft GTEx, Blueprint and CCLE Lands were released and mapped to Human.B38 and OmicsoftGenCode.V33. Be sure to use these Lands to get the most up-to-date data!
- GTEx_B38_GC33: 17,000 RNA-seq samples from 51 normal tissues, as well as expression microarray data.
- CCLE_B38_GC33: Over 1000 cancer cell lines, profiled for RNA-seq, DNA-seq mutation, CNV, DepMap Gene Dependency (CRISPR and RNAi), MS, and RPPA proteomic data.
- Blueprint_B38_GC33: 628 normal hematopoietic cell expression profiles.
In addition, TRACERx_B38_GC33 (multi-omics non-small cell lung cancer) and DLBCL_NCI_B38_GC33 (diffuse large cell B cell lymphoma, controlled-access application required) are available on the latest gene model.
Oncoland Highlights
- Hundreds of new projects added to OncoGEO and OncoMouse
- Coming Soon: TCGA_B38, reprocessed on OmicSoftGenCode.V33
OncoGEO
In this release, there are 4110 new samples and 1245 new comparisons from 102 projects added to OncoGEO, focusing on renal clear cell carcinoma, hepatocellular carcinoma, glioblastoma, colon and colorectal cancers, cervix carcinoma and breast carcinoma.

Figure 1. Distribution of new oncology-focused samples in OncoGEO 2020R4, grouped on the Y-axis by Tissue and colored by DiseaseState.
Hematology
We added 1822 samples and 557 comparisons from 55 projects in this release, with new studies on multiple myeloma, acute myeloid leukemia, diffuse large B-cell lymphoma, chronic lymphocytic leukemia and more.

Figure 2. Distribution of new hematologic cancer-focused samples in Hematology 2020R4, grouped on the Y-axis by DiseaseState and colored by CellType.
OncoMouse
In this release, we added 361 samples and 121 comparisons from 19 projects to OncoMouse_B38, with new studies relevant to chronic lymphocytic leukemia, myelodysplastic syndrome, multiple myeloma, mantle cell lymphoma and more.

Figure 3. Distribution of new oncology model samples in OncoMouse 2020R4, grouped on the Y-axis by DiseaseState and colored by Tissue.
DiseaseLand Highlights
- New studies on viral infections, including COVID-19 and HIV
- New studies on psychiatric disorders, neurodegenerative disorders, celiac disease and more
- Coming soon: HumanDisease on Human Genome B38, OmicSoftGenCode.V33
HumanDisease
In this release, we added 7579 samples and 3234 comparisons from 137 projects to HumanDisease_B37. Among the many diseases covered in the new projects, a particular focus was on viral infection, including further studies on COVID-19, MERS and HIV, as well as studies on schizophrenia, autism spectrum, bipolar, celiac disease, diabetes and more.

Figure 4. Distribution of new Disease-focused samples in HumanDisease 2020R4, grouped on the Y-axis by DiseaseState and colored by Tissue. Normal control and Disease Control samples were hidden.
MouseDisease
With 4364 samples and 994 comparisons from 97 projects, MouseDisease_B38 has new content on allergy, Alzheimer's disease, autism spectrum, chronic kidney disease, graft-vs-host disease, Huntington's disease, toxoplasmosis and diabetes.

Figure 5. Distribution of new Disease model samples in MouseDisease 2020R4, grouped on the Y-axis by DiseaseState and colored by Tissue. Normal control and Disease Control samples were hidden.
2020R3 Land Release Notes
In this content release, we added hundreds of new projects to OncoLand and DiseaseLand, and a new Land focused on non-small cell lung cancer (NSCLC). If you are not able to access a Land of interest to you, please ask your OmicSoft Server administrator to check the Cloud Land Publishing function for available data.
Oncoland Highlights
- New Land: TRACERx Land for Non-small cell lung cancer
- Updated CCLE and Blueprint B38 Lands to GenCode.V33
- Curation focus on colorectal cancer projects and immunotherapy, including anti-PD1/PD-L1 and CTLA4 checkpoint modulators
- MMRC dataset update in Hematology_B37
TRACERx
The TRACERx (TRAcking Cancer Evolution through therapy (Rx)) study focuses on the progression of NSCLC.
In this new TRACERx_B38_GC33 Land, 447 samples from 100 patients, with somatic mutation, copy number, clinical covariates and survival data, are available for analysis.

Figure 1. Sample distribution of lung samples in TRACERx_B38_GC33. Using the filters for Sample Origin (excluding peripheral blood and lymph node samples) and Sampling Time (excluding post-treatment samples) and grouping on Histology, the number of samples from different subtypes of NSCLC are displayed. Multiple tumor regions (up to 8) were sampled per tumor.

Figure 2. Differential mutation frequency in pre-treatment invasive vs. squamous NSCLC samples in TRACERx Land. After filtering for pre-treatment lung samples with histology indicating either invasive or squamous adenocarcinoma NSCLC, a Sample Set was generated to compare the two histologies for mutation frequencies with the OmicSoft Lands "Sample Grouping to Mutation" function. Among the top mutations found enriched in one group vs. the other, TP53, PIK3CA, CDKN2A and many other genes were more frequently mutated in squamous (green) samples, whereas KRAS and AMER3 were more frequently mutated in invasive (blue) samples.
Blueprint and CCLE B38/Gencode.V33 update
Lands continue to be updated to the new OmicsoftGenCode.V33 gene model on Human.B38 genome, with Blueprint (normal blood cell type expression) and CCLE (cancer cell line expression) updated this release. Look for the "B38_GC33" suffixes to find these latest data; your QIAGEN OmicSoft Administrator will need to add these to your OmicSoft Server with Publish Cloud Lands.
CCLE_B38_GC33 also includes a significant update to available data, with new RNA-seq, mutation, copy number and protein data, along with the DepMap CRISPR/RNAi gene dependency data.
OncoGEO
In this release, 3314 samples from 65 projects were added to OncoGEO, with a focus on immune checkpoint therapies targeting PD-1 pathway and CTLA4, CNS cancers, female reproductive cancers, liver, prostate, and colorectal cancers, prostate cancer, lung cancers and skin cancers.

Figure 3. Sample distribution of OncoGEO 2020R3 additions, filtering out disease control and normal control samples.
Hematology
In this release, we added 6781 samples from 109 projects to Hematology_B37. New studies for a variety of leukemias and lymphomas were added.
MMRC update
MMRC-related projects (ProjectIDs GSE26760, GSE26849, and MMRC) were updated with new metadata to enhance the interpretation of these datasets. For ProjectID MMRC, the columns Translocation[IGH], Cytogenetics, Gender, AgeAtDiagnosis[years], SampleMaterial, CellType, CellMarkers, and CellPurity were added. For ProjectIDs GSE26760 and GSE26849, DiseaseHistory, PatientStatus, SampleMaterial, and CellPurity were added; and HeavyChainClass and LightChainClass columns were merged in ImmunoglobulinClass.

Figure 4. Sample distribution of Hematology 2020R3 additions, filtering out normal control samples.
OncoMouse - disease areas
In this release, we added 511 samples from 24 projects to OncoMouse_B38, with new studies relevant to anti-PD1/PD-L1 and anti-CTLA4 immunotherapy agents, Female Reproductive Cancers of Breast and Ovary, lung cancers, and kidney and bladder cancers.

Figure 5. Sample distribution of OncoMouse 2020R3 additions, filtering out disease control and normal control samples.
DiseaseLand
Highlights:
- Includes new studies on aging of various organs and systems, neurodegeneration, skin disorders, and immune-mediated disorders
- New studies on viral infections, including coronavirus, and infection responses, including acute respiratory distress syndrome (ARDS)
In this release, we added 7021 samples from 133 projects to HumanDisease_B37. Among the many diseases covered in the new projects, a particular focus was on aging-related gene expression changes in aging of the brain, eye, immune system, liver, muscle, skin and more (use the project filter Keywords to find "aging" studies).
In addition, new studies relevant to coronavirus research were added (COVID-19, SARS, MERS, ARDS and other complications), as well as Alzheimer's Disease, Huntington's Disease, Parkinson's Disease, arthritis, asthma, chronic obstructive pulmonary disease (COPD) and skin disorders.

Figure 6. Sample distribution of HumanDisease 2020R3 additions, filtering out disease control and normal control samples.
MouseDisease
With 2362 samples from 83 projects, MouseDisease_B38 has new content on aging, Alzheimer's Disease and Parkinson's Disease models, immune-related diseases such as graft-vs-host disease and lupus, as well as skin diseases.

Figure 7. Sample distribution of MouseDisease 2020R3 additions, filtering out disease control and normal control samples.
RatDisease
In RatDisease_B6, we added 637 samples from 21 projects, with studies focused on aging, cirrhosis, Alzheimer's disease and Parkinson's disease.

Figure 8. Sample distribution of RatDisease 2020R3 additions.
2020R2 Land Release notes
Our latest Land content updates, released July 1, bring you new datasets, ready to be explored to discover patterns of gene and transcript expression across normal tissue and disease expression. Check out the new projects added to HumanDisease, MouseDisease and OncoGEO, and the thousands of new normal tissue samples in GTEx_B38.
GTEx_B38 V8 - First Land on GenCode.V33
With 2020R2, we released our first Land on Human_B38/OmicSoftGenCode.V33, with over 16,000 RNA-seq samples profiling normal tissue expression.
To maintain compatibility with older Virtual Lands that include GTEx_B38, we released this update as GTEx_B38_GC33 (B38 refers to Human Genome version B38; GC33 refers to GenCode Version 33).

Figure 1. Gene FPKM of ACE2 across 16,963 samples from GTEx_B38_GC33.
This Land has been added automatically to hosted servers; if you have an onsite Land installation, please use Cloud Land Publishing to add it to your collection.

Figure 2. GTEx_B38_GC33 and other Lands, ready to be installed to the Land collection.
We will continue to release updated versions on this new genome and gene model, starting with the most popular Lands. We will continue to use the OmicSoft Aligner (OSA) and RSEM quantification; a benchmark white paper is in progress.
DiseaseLand
DiseaseLand content highlights:
Coronavirus-related research: In this release, we added 1119 samples and 920 comparisons from 23 projects to HumanDisease, and 357 samples and 203 comparisons from 11 projects MouseDisease. These provide insights into coronavirus infection, associated lung damage, treatment and immune response.
New data: With the latest release, we've added the following data:
- HumanDisease_B37: 7812 new samples and 1856 new comparisons from 118 projects
- MouseDisease_B38: 1533 new samples and 729 new comparisons from 87 projects
- Areas of focus:
- Coronavirus-related: (SARS, MERS), acute lung injury, acute respiratory distress syndrome (ARDS)
- Liver disease (NAFLD, NASH, liver fibrosis)
- Autoimmune disorders
- Type 2 diabetes

Figure 3. Sample distribution of new data added to HumanDisease_B37 in 2020R2.
HumanDisease Projects:

MouseDisease Projects:
<strong
OncoLand
With the latest update to OncoGEO, we added 4622 new samples and 832 comparisons from 112 projects.
Areas of focus:
- Prostate cancer
- Bladder cancer
- Kidney cancer
- Lung cancer

Fig 4. Sample distribution of new data added to OncoGEO_B37 in 2020R2.
Note to OmicSoft Server Administrators
If you haven't restarted your Land server recently, consider doing this during a period of low usage. We've released several new improvements, and this also ensures that the latest files have been synchronized.
What's new in the QIAGEN OmicSoft 2020R1 and 2020R1.1 releases
QIAGEN OmicLand 2020R1 release notes
The OncoLand and DiseaseLand 2020R1 release is out! Servers should automatically update during low-traffic periods overnight.
Release Schedule
To enable the fastest release of data, this release was released in two batches: GTEx_B37, OncoGEO and HumanDisease were released on April 24, 2020; OncoMouse, MouseDisease and RatDisease were released on May 11, 2020.
In case you missed it...
OncoLand has several new Lands available, be sure to check them out! If you do not see this in your OncoLand collection, please contact your OmicSoft Server administrator to add the Lands to your server.
-
- OncoMouse_B38: Curated oncology studies in mouse model.
- BeatAML_B37/B38: In-depth investigation of the various genetic classes of AML that have recently been discovered, with expression and mutation data, as well as ex-vivo drug sensitivity data that can be added as measurements.
- CCLE_DepMap_Preview_B37/B38: All the data in CCLE Lands, with additional gene dependency measurements from CRISPR and RNAi knockdown experiments, as well as new visualizations to correlate these data.
Body Maps
GTEx_B37 has 8,711 new RNA-seq samples, with16,964 total RNA-seq samples. GTEx_B38 is scheduled to be updated to GTEx V8 with 2020R2.

Figure 1: Sample distribution of GTEx samples across tissues, colored by whether they were added in the latest release.
The Tissue metadata column now uses OmicSoft's controlled vocabularies, making it simpler to build virtual Lands. GTEx metadata terms can be found in Tissue_GTEx and TissueDetail_GTEx.
New projects in OncoLand 2020R1

Figure 2: New projects in OncoGEO and OncoMouse.
- OncoGEO_B37: 117 new projects, 8236 new samples and 1777 new comparisons
- This release is focused on breast, ovarian, bladder and prostate cancers. New comparisons explore treatment responsiveness, mutation status, and more!
- OncoMouse_B38: 33 new projects, 545 new samples and 192 new comparisons
- Hematology_B37: 5 new projects
New projects in DiseaseLand 2020R1

Figure 3: New projects in Human, Mouse, and Rat Disease.
- HumanDisease_B37: 111 new projects, 6724 new samples and 3849 new comparison
- A new developmental map of 7 organs from 4 weeks post-conception to adulthood (E-MTAB-6814)
- Inflammatory disease: Effect of stimuli of blood samples from Systemic Juvenile Idiopathic Arthritis (GSE103500)
- RatDisease_B6: 14 new projects, over 6112 new samples, 3102 new comparisons
- A new developmental map of 7 organs (E-MTAB-6811)
- Compound profiling in Rat tissues: GSE57822
- MouseDisease_B38: 79 new projects, 2437 new samples, 1102 new comparisons
- A new developmental map of 7 organs (E-MTAB-6798)

Figure 4: Comparisons from E-MTAB-6814, a developmental map of the human transcriptome across 7 tissues. Similar datasets are in MouseDisease (E-MTAB-6798) and RatDisease (E-MTAB-6811). In the Comparisons Distribution View, the ProjectName filter was used to find E-MTAB-6814. Comparison groups were specified by "Specify Histogram Columns: Case.ExperimentGroup", and subgrouped with "Specify Group Column: Case.ExperimentGroup".
QIAGEN OmicSoft Array Suite 2020 R1.1 release notes
This release includes several minor improvements. Please review these latest improvements and update if any would be useful for your research.
OmicSoft Studio improvements:
- The Single Cell Quantification function now supports antisense strand reads (commonly generated from 5' chemistry) in addition to sense strand reads (generated from 3' chemistry), increasing the flexibility to support new workflows.

- Users of the "Studio on the Cloud" AWS add-on can now specify the Amazon Machine Image (AMI), expanding the capabilities for studio-based cloud analysis.

- The "Import and Unstack Table" function now supports the option not to prepend each column name with a label of the source row. This is useful when importing results from external tools.

- In "Map RNA-seq reads to genome", there is a new option to pair input files in the order they were submitted, instead of pre-sorting the files by name. This is useful in exceptional situations, such as when data for the same sample are stored across multiple files in multiple directories, and the file names are identical among directories.

For example, if your data were run across multiple lanes, and the output files for Read1 are saved as "Batch2_1_S1_L001_R1_001.fastq.gz" in multiple directories (each directory holding data from one lane), you can ensure proper file pairing by specifying the order with "Add List" or during sample registration, and by selecting "pair files in order" when specifying alignment options.

In this example, "Pair Files In Order" will take all the files for Sample201 in the listed order, and properly pair those in folders "aRename" and "bRename".
- QIAGEN Digital Insights has a unified EULA now; you will be automatically prompted to review it the next time you start OmicSoft Studio, and can review it at any time here.
Server improvements:
- Now you can download FASTQ files up to 100 GB from the Short Read Archive. Previously, downloading FASTQ data from the NCBI Short Read Archive (SRA) database supported files only up to 20 GB.
- Logs for External Script (Escript) analyses will include the named External Script, e.g., Performing Escript action (Mode=EScript for observation KallistoQuant).
- If OmicSoft Server is configured in "Master/Analytic Server" configuration, Reference Library and Gene Models built on either Master or Analytic server will be listed in drop-down menus. Previously, only Reference Libraries and Gene Models on the Master Server would have been listed, regardless of Analytic Server connected.
Bug fixes:
- In Land Explorer, internal Lands with comparison data missing PubMedID entries will successfully load.
- The "Remove Comparisons from Land" now generates a properly-formatted oscript.
- An issue that created a non-working desktop shortcut to "QIAGEN OmicSoft Studio Launcher" when launching OmicSoft Studio is now fixed.
- When exporting Land data using "Download Selected Samples Across All Genes", specifying a VariableSet to limit the metadata columns will now fetch only metadata for the selected samples.
QIAGEN OmicSoft Suite 2020 R1 Release notes
A new version of QIAGEN OmicSoft Suite has been released. Please review the latest improvements and update your OmicSoft Server at the next available opportunity to take advantage of these new features included in version 10.2.7!
- Array Suite is now OmicSoft Suite! This is purely a name change to reflect the wide variety of Omics data supported by OmicSoft.
- OmicSoft Studio=Array Studio. OmicSoft Server=Array Server. OmicSoft Viewer=Array Viewer.

- Support for Docker images and cloud analysis with External Scripts improvements
- OmicSoft Suite now supports External Scripts on AWS Cloud, and can run analyses on Docker images.
These new capabilities substantially expand the options for QIAGEN OmicSoft Suite as an 'omics data and analysis hub, allowing advanced users who would like to run third-party bioinformatics tools to do so from OmicSoft Suite, and even build pipelines to analyze data and import into OmicSoft projects. Talk with your account manager to learn more about some of the possibilities, or check out these links.
- OmicSoft Suite now supports External Scripts on AWS Cloud, and can run analyses on Docker images.
- General info about External Scripts and Dockers: http://www.arrayserver.com/wiki/index.php?title=External_Scripts_with_Dockers
- Changes to External Scripts syntax to support Dockers and cloud: http://www.arrayserver.com/wiki/index.php?title=External_Script_Syntax
- Kallisto Docker example: http://www.arrayserver.com/wiki/index.php?title=Dockerized_Kallisto_Cloud_Command
- Kallisto Docker pipeline example (with GUI): http://www.arrayserver.com/wiki/index.php?title=Dockerized_Kallisto_Cloud_Pipeline
- STAR Docker example (uses a public Docker image): Dockerized STAR - http://www.arrayserver.com/wiki/index.php?title=Dockerized_STAR_Align
- New "Project Land" capabilities for building internal Lands
- This new feature supports quick download of full OmicSoft projects from the Land framework, compatible with your OmicSoft Suite+Cloud installation. Simply zip up an OmicSoft project (.osprj and subfolder) and store it on an accessible bucket, then build a simple Land
- This technology is also used for OmicSoft Single Cell Project Lands, available soon! If you are interested in previewing OmicSoft's Single Cell enhanced curation protocol, contact your QIAGEN Account Manager and ask for access to "Single Cell Project Lands".
- Improvements to single-cell preprocessing (oscript only)
- Single-cell preprocessing (non-10x) now supports cell barcode correction, matching the 10x preprocessing function's capability of "fuzzy" matching to cell barcode white lists
- 10x preprocessing and non-10x preprocessing oscript support /DeleteSkippedReads and /ExportSkippedReads options to manage output files
- 10x and non-10x preprocessing functions will summarize the top reasons for skipped reads for each sample with /SummarizeSkippedReads
- Server startup optimizations
- DisableParallelLandLoading enforces Land Loading individually, instead of using all CPUs specified with CPUNumber in ArrayServer.cfg
- Improved BAM CIGAR handling
- SAM/BAM reads that contain '=' or 'X' will be loaded and reads will be displayed
- "Validate SAM/BAM" will validate files that contain a read with '=' or 'X'
Software maintenance to consider:
- If you subscribe to OmicSoft Cloud, be sure to update your AMI to take advantage of Docker support: http://www.arrayserver.com/wiki/index.php?title=Build_AWS_Ubuntu_AMI_for_OmicSoft_Cloud_Computing
- Check your ArrayServer.cfg SMTP settings if you would like to get notifications when analysis jobs complete: http://www.arrayserver.com/wiki/index.php?title=ArrayServer.cfg#Email_Options
- We've released a new OmicSoft Studio Launcher. Users will be prompted to update to this new launcher, but can opt to not update to the latest OmicSoft Studio Version. http://omicsoft.com/software/ArrayStudioLauncher/publish.htm
Additional details on major improvements:
Docker support and cloud support for External Scripts
With version 10.2.1 we are proud to support for Docker images in "External Scripts". This is considered an advanced feature for OmicSoft "power-users" who want to extend their OmicSoft Suite capabilities beyond tools integrated into the software. Because of the wide variety of tools that can run in Docker images, OmicSoft Support cannot provide debugging support for each tool, but will be happy to answer questions about External Scripts syntax, provide tutorials and example scripts. The QIAGEN Discovery Services team can also work with you to build full pipelines and workflows using External Scripts and Docker images for a variety of bioinformatics needs.
To support External Scripts on AWS, you will need to use an updated AMI. Please visit http://www.arrayserver.com/wiki/index.php?title=Build_AWS_Ubuntu_AMI_for_OmicSoft_Cloud_Computing
To support Docker in External Scripts on your onsite OmicSoft Server installation, please install Docker v19.
More useful resources:
- An introduction to External Scripting: http://www.arrayserver.com/wiki/index.php?title=External_Script_Integration
- Example External Scripts with Docker parameters: http://www.arrayserver.com/wiki/index.php?title=Docker_Escript_Examples
A full log of all the changes is located in the Help menu of the Analysis tab in OmicSoft Studio. To download this log, click here:

New features in the QIAGEN OmicSoft 10.1.2 release
Land visualizations: CRISPR/RNAi dependency screen data with multi-'omics integration views. Directly explore correlations of expression, mutation and gene dependency data in the updated CCLE Land, updated with DepMap data. Use the “Add Measurement Data” function to bring in additional data such as drug sensitivity and metabolomic data.
Cloud Analysis: Map S3 buckets from multiple AWS accounts, and on master/analytic server setup. More flexible cloud configurations allow you to map buckets from collaborators and other shared buckets with your access/secret keys.

In case you missed it: Find out what was included in the 10.1 release (October 2019)
Cloud analysis: Spot Instance support. AWS spot instances use idle EC2 resources, which can be requested at significant cost savings over on-demand instances.
Single-cell analysis: Improved importing of Single Cell Expression Matrices. Merge memory-efficient Zero-Inflated Matrix (ZIM) data from multiple samples to compare single-cell data from multiple experiments.
.NET 4.5 Framework: Update from .NET 3.5 framework.
IPA integration: Multi-identifier uploads. Now you can specify up to five molecule identifier columns in your inference table when uploading from OmicSoft to IPA. This feature is especially useful for metabolomic studies.

DiseaseLand updates – 2019R3
Human disease updates: 48 new projects, with a focus on amyotrophic lateral sclerosis, Alzheimer’s disease, Huntington’s disease and HIV.
Mouse disease updates: 50 new projects, with a focus on models of amyotrophic lateral sclerosis, Alzheimer’s disease and Huntington’s disease.
In case you missed it: We added 67 projects and 1285 samples, with a focus on ophthalmology.
OncoLand updates – 2019R3
New Land: OncoMouse. Oncology-focused studies in mouse models, with 48 projects in the initial release.
OncoGEO updates: 68 new projects, with a focus on cancers of the reproductive system, GI system, respiratory system, urinary system, skin and CNS.
CCLE update: CRISPR/RNAi screen data have been integrated into CCLE Lands, enabling new multi-'omics comparisons.
In case you missed it: We added a new Land. BeatAML includes RNA-seq, DNA-seq and ex-vivo drug responses for over 500 patients.
OncoGEO/hematology added 58 new projects and 3653 samples, with an emphasis on hematologic cancers.
February 2019: New Features with this Release
- Access new hereditary disease variant annotations and functional prediction tools
- Get instant annotation of hereditary diseases from HGMD Professional in Array Suite, along with functional predictions from SIFT, PolyPhen2, MutationTaster, and LRT
- Take greater control of your data using Python programming
- Perform Land queries, customized data analysis, and Array Server system management using the OmicPython Application Programming Interface (API).
Land Explorer Updates
Customize and share your gene expression, protein level and mutation views with ease
Land Explorer now supports web-based access to Land data with over 100 visualizations for expression, fusions, protein levels and mutations. Custom visualizations can easily be shared with colleagues using customized web links. Access and explore all the Land data that are important to you
The Sample Explorer and Comparison Explorer pages summarize data across every Land in interactive plots. Use filters to identify the samples of interest to you and discover every Land with data relevant to your research.
GeneticsLand Updates
- First GeneticsLand content on GRCh38
- GWAS results from the UK Biobank lifted to GRCh38, with a new phenome plot available to visualize all the associations for a given variant
- Access more OmicSoft curated genome-wide association data from the GWAS Catalog
- Explore 11,382 phenotypes and millions of variant association summary statistics, including 3,975 studies from the GWAS Catalog
- Explore non-coding somatic cancer mutations from TCGA with potential regulatory effects
- Access 828 whole-genome somatic mutation samples across 22 cancer types, from the PanCancer Analysis of Whole Genomes
DiseaseLand Updates
- Identify key oncogenes and tumor suppressors in cell lines from CRISPR and RNAi knockdowns
- Brand-new Lands with CRISPR/RNAi dependency screen data from Project Achilles and Project DRIVE. Discover how hundreds of cell lines are affected by individual knockdowns of genes across the transcriptome
- Access enhanced viral infection, cardiovascular disease, obesity and diabetes data
- DiseaseLand added projects, samples and comparisons with a focus on dermatology, viral infection, cardiovascular disease, obesity and diabetes
- A new MouseDisease gene model featuring miRNA gene annotations is now available.
- Quantify and normalize gene expression of Single-Cell RNA sequencing data
- Single-Cell Lands now feature new cell types, including hematopoietic stem cells (HSC), peripheral blood stem cells (PBSC), lung epithelial stem cells and olfactory receptor cells. In Array Studio’s Single Cell analysis, you can now quantify and normalize gene expression to Reads Per Million in a single step, and quickly overlay expression in tSNE clustering views.
OncoLand Updates
Access the largest Land of published oncology projects
- Explore new immuno-oncology studies in OncoGEO_B37, our largest Land of published oncology projects: Explore even more miRNA data from gastrointestinal, reproductive and urinary system cancer samples.
- Get more new insights from The Cancer Genome Atlas (TCGA) Land: You get more insights with the addition of new metadata content from the recent PanCancer Atlas publications, along with updated copy number (CNV) and protein quantification data.
- Explore enhanced cancer genomic data: Hundreds of new projects have been added, as well as updates to consortium datasets including Broad Institute Cancer Cell Line Encyclopedia (CCLE), Genotype-Tissue Expression (GTEx) project, International Cancer Genome Consortium (ICGC), AACR Project Genomics Evidence Neoplasia Information Exchange (GENIE), and Sanger Lands.
August 2018 Release: New Features with this Release
GeneticsLand Updates
- Now access electronic health record phenotypes with the addition of PheWAS data
- As part of the GeneticsLand data service, we curated Phenome-Wide Association Study (PheWAS) results from the UK Biobank and the PheWAS Catalog, giving you access to 3,777 new phenotypes and 26 billion variant association summary statistics
- Improve the identification of interesting variants
- Each variant is annotated with 1000 Genomes, gnomAD, ClinVar, Conservation, dbNSFP, GTEx, GWAS Catalog, GRASP, GWAVA, RegulomeDB, OMIM, HGNC, InterPro, and DGIdb. More annotation sources are available upon request.
DiseaseLand Updates
- Access more expression data for autoimmune disorders, heart disease, and stroke-related projects
- HumanDisease, MouseDisease, and RatDisease Lands now contain over 360 additional projects that include 12,000 new samples and 1,700 new comparisons
- Explore new cell types in single cell lands
- Single Cell Lands (SCHuman, SCMouse, and SCRat) have 27 new projects with over 21,000 new samples. New cell types include hair follicle stem and progenitor populations, innate immune cells, and in vitro cultured neurons.
OncoLand Updates
Improve your genetic characterization of human cancer cell lines
- The Cancer Cell Line Encyclopedia (CCLE) Land contains updated DNA-seq mutation and RPPA data recently released on the Broad portal
- New drug measurements from the Cancer Therapeutics Response Portal are also available upon request
- New clinical features curated from TCGA PanCancer Atlas publications
- The Cancer Genome Atlas (TCGA) Land now features over 150 new metadata columns, including additional survival metrics derived from recent PanCancer Atlas publications
- Enhanced data content (DNA mutation, copy number, and expression)
- MET500 (metastatic cancer cohort) Land now available for genome reference library B38
- American Association for Cancer Research GENIE Land has been updated to version 3 with over 21,000 new samples
- OncoGEO B37 Land has approximately 10,000 additional samples.
- The Human Protein Atlas (HPA) Land has new tissue microarray data