

Analysis Match enhances interpretation and drives discovery by placing your dataset in the context of over 100,000 IPA analyses that have been processed from public sources using QIAGEN OmicSoft Suite.
Powered by IPA Advanced Analytics, Analysis Match automatically identifies curated IPA datasets with significant similarities and differences, enabling you to compare results, validate interpretation and better understand causal connections between diseases, genes, and networks of upstream regulators.
By combining a massive compendium of knowledge from the literature together with a massive collection of gene expression measurements. Watch the 5 minute video below.

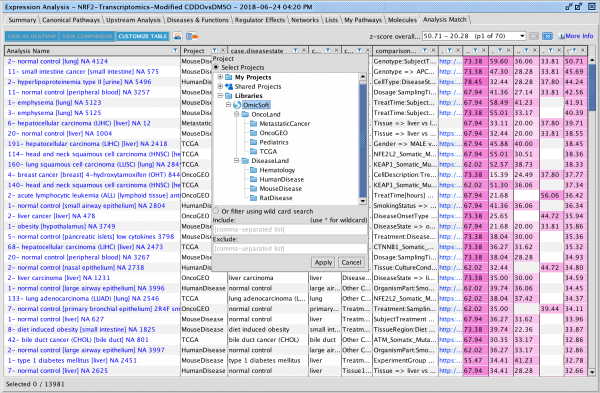
Figure: Analysis Match tab
Analysis Match uses “analysis-to-analysis” matching based on shared patterns of Canonical Pathways, Upstream Regulators, Causal Networks, Diseases and Functions. Using comparative datasets from QIAGEN OmicSoft's DiseaseLand and OncoLand, Analysis Match provides you with clearly organized results, easy to use filters and heatmap visualization of similarities and differences.

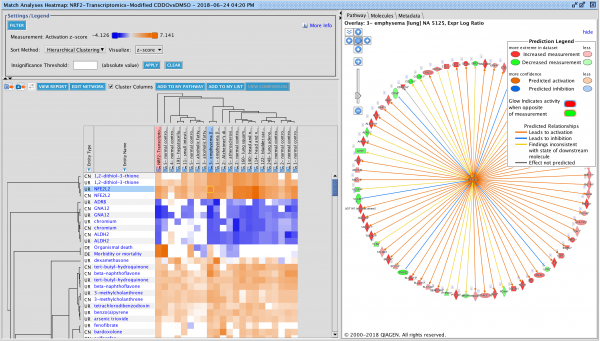
Figure: Matching signature heatmap
Visualize and explore the activity of a single QIAGEN IPA entity, such as an Upstream Regulator, Causal Network, Canonical Pathway, Disease or Function, across >100,000 OmicSoft Land analyses. The Activity Plot helps you gain insights into an IPA entity by exploring its predicted biological activity across thousands of datasets that represent disease conditions, treatment conditions, knockouts and much more in the Analysis Match database.

Check out our latest webinar to learn how to use the new Analysis Match feature to discover other QIAGEN IPA Core Analyses with similar (or opposite) biological results. Automatically match your analysis to your previous data and over 100,000 pre-computed datasets from OmicSoft. Broaden the scope of your discovery.