


Discover how cutting-edge tools like QIAGEN Ingenuity Pathway Analysis and OmicSoft Lands can unlock hidden insights into drug resistance in breast cancer. This blog dives into how systems biology transforms complex omics data into actionable knowledge about drug resistance, metastasis, and therapeutic strategies.
Understanding the mechanisms behind cancer resistance remains a central challenge in cancer drug target discovery. In a study published in Cell Death & Differentiation (Zhang et al., 2021), researchers at the University of Salford and University of Calabria explored how breast cancer cells develop resistance to treatment through complex cellular adaptations (1). They proposed that high intracellular ATP production – specifically driven by mitochondrial ATP synthase – acts as a driver of tumor aggressiveness and metastasis. As a result, high ATP output might not just support cancer cell survival and proliferation but could also enhance aggressive behaviors such as migration, invasion, and resistance to therapy.
You can read a full summary of the research study here.
As part of their investigation, the researchers performed advanced bioinformatics using QIAGEN IPA to identify enriched biological pathways and predict upstream regulators. Then, they utilized OmicSoft Lands to perform comparative analysis against large-scale cancer datasets to validate their findings across tumor types. They identified key pathways and gene expression changes that differentiate metastatic from primary tumors.
To build on these findings, we want to show how QIAGEN IPA and OmicSoft Lands can be used to take a systems-level approach and probe deeper into how these resistance mechanisms relate to broader disease biology. Below is a walkthrough of how researchers could use these tools to contextualize, compare, and extend the paper’s discoveries.
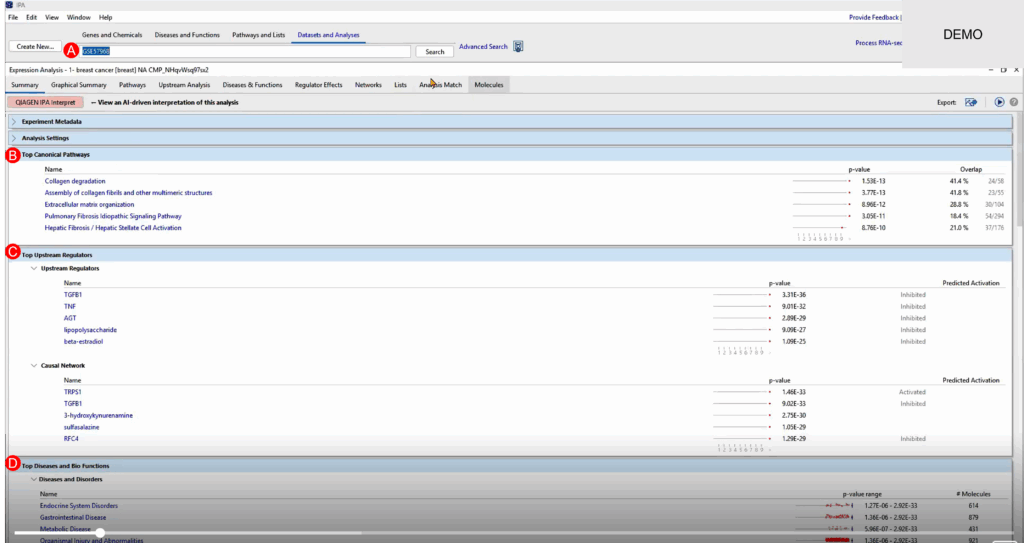
We begin by selecting one of the expression datasets from the study—specifically comparing metastatic versus primary breast cancer tumors. After uploading the gene expression matrix into IPA and running a Core Analysis, we get a comprehensive output highlighting:
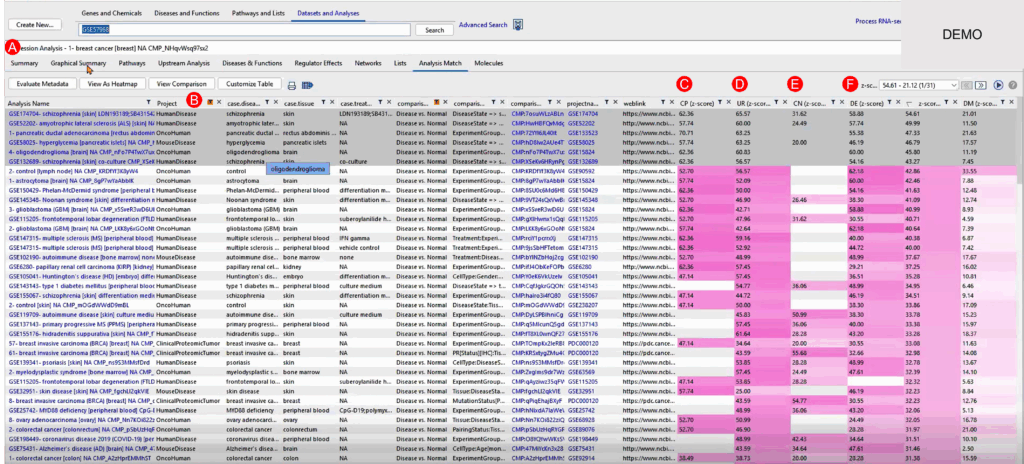
QIAGEN IPA’s Analysis Match function enables us to compare our breast cancer dataset against thousands of curated studies, many of which are accessible via OmicSoft Lands. We focused on oncology- and disease-relevant datasets, looking for shared or anti-correlated biology based on four major features:
Surprisingly, the top matches weren’t only other breast cancer studies, but also included datasets from ALS (Amyotrophic Lateral Sclerosis) and schizophrenia. This suggests converging biological processes or molecular responses, even across seemingly unrelated conditions.
The overall z-score (averaged across all four facets) helps rank these comparisons. A positive z-score indicates biological similarity, while negative z-scores (anti-matching) highlight datasets where treatment, suppression, or reversion of disease states may have occurred—valuable for understanding potential therapeutic mechanisms.
Using QIAGEN IPA’s Comparison Analysis, we aggregate our breast cancer dataset with those that matched closely or anti-matched. From this comparison, we:
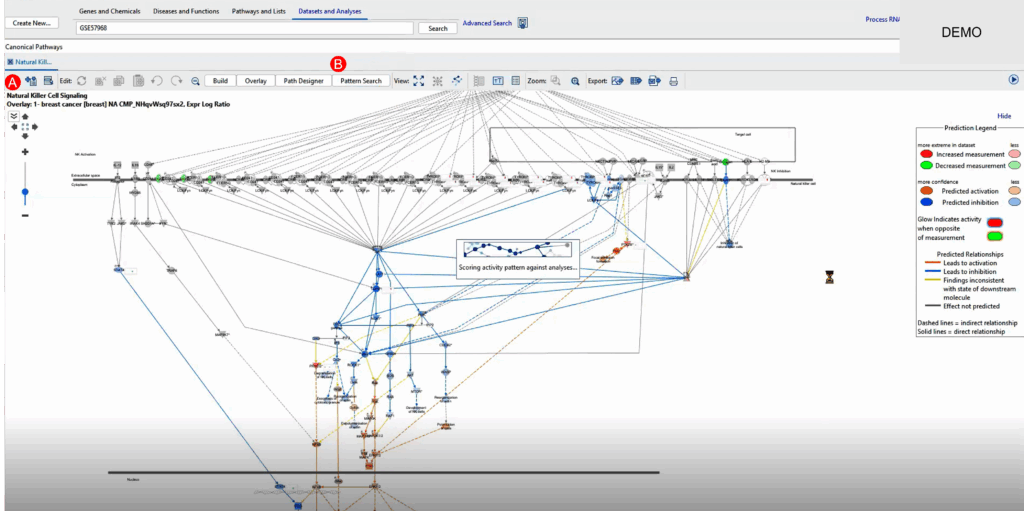
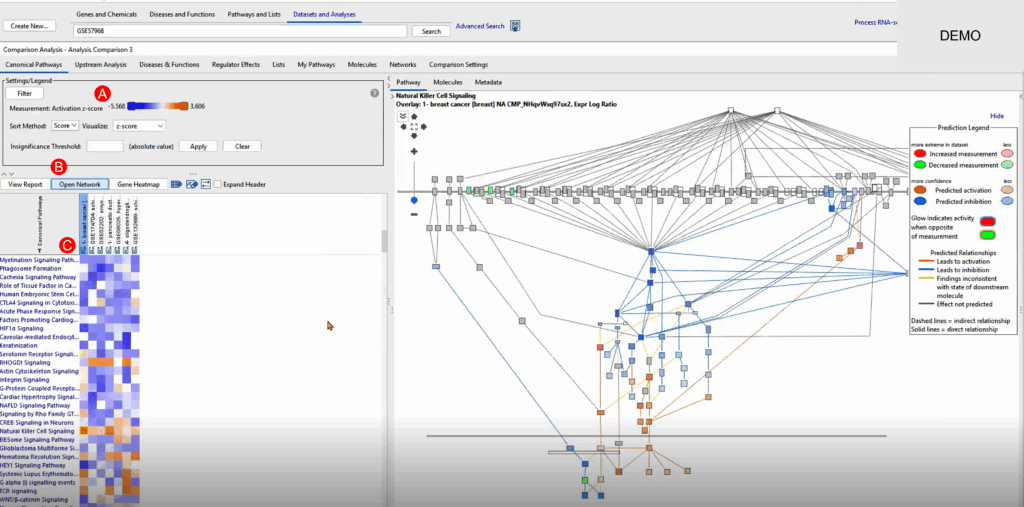
One of QIAGEN IPA’s most intuitive features is its Open Network function. Suppose we identify an interesting ATP-related pathway. By launching the network view, we visualize gene-to-gene interactions, regulatory loops, and potential feedback mechanisms.
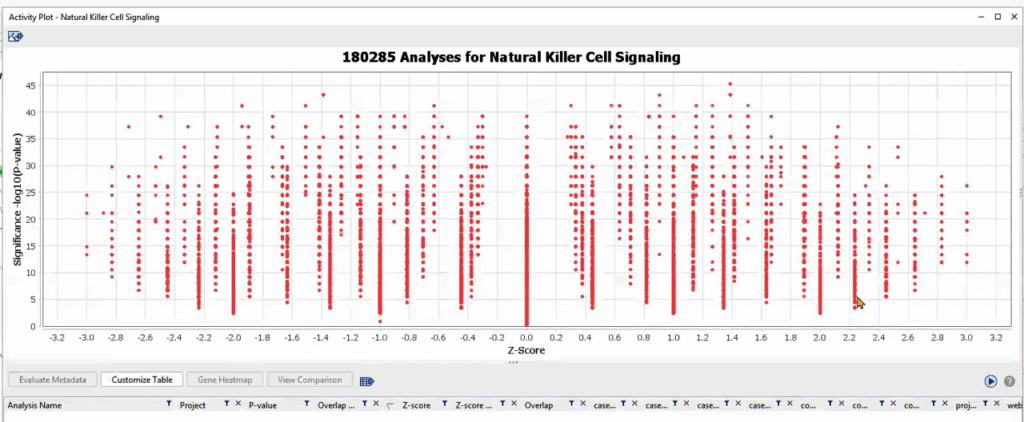
From here, we can conduct a Pattern Search to see where else these genes show up, especially focusing on those contributing to Natural Killer (NK) cell signaling—a pathway potentially suppressed in metastatic samples. A positive pattern z-score confirms the coherence of expression trends in new datasets, suggesting shared regulatory biology.
Another powerful angle is hypothesis testing by building custom networks. From the original paper, we extract key genes implicated in drug resistance and metastasis (e.g., ABCB1, MMP1, IL6, STAT3). By constructing de novo networks around these genes, QIAGEN IPA can identify:
This gives us the ability to validate whether the paper’s findings hold mechanistic weight in broader datasets and uncover new therapeutic entry points.
By leveraging QIAGEN IPA and OmicSoft Lands, we’ve moved beyond single-dataset interpretation to a multi-dimensional, systems biology framework. Not only can we validate findings from the study, but we can also identify unexpected disease parallels, track inverse treatment effects, and build custom mechanistic networks to hypothesize interventions.
This integrative strategy transforms omics data into meaningful insights, bringing us closer to unraveling the complex systems of cancer drug target discovery.
Want to learn more? Explore our robust portfolio of bioinformatics software, databases, and services is purpose-built to guide your cancer drug research, from early discovery to clinical development. [Insert link to new campaign page]