


Paula Tataru, Ph.D, Senior Bioinformatics Scientist
The new Whole Genome Alignment plugin, available for the CLC Main Workbench, CLC Genomics Workbench, and the CLC Genomics Server, makes it straight forward to undertake comparative sequence analysis of whole genomes. Here, we introduce core functionality provided by this plugin, which includes aligning multiple genomes, calculating average nucleotide identities, visualizing genomic relationships, and extracting multiple sequence alignments for further processing.
Notes:
The Create Whole Genome Alignment tool aligns multiple small to medium-sized genomes (up to 100M bases). Seeds, which are short stretches of nucleotide sequence present in multiple genomes but not present multiple times on the same genome, are first identified, and then iterative rounds of scoring, extension, and merging of seeds follow, creating alignment blocks. A whole-genome alignment is made up of a collection of these alignment blocks plus information about any genome rearrangements between the blocks.
The Create Average Nucleotide Identity Comparison tool calculates average nucleotide identity (ANI), a quantitative measure of the similarity between genomes. For each pair of genomes in alignment, the ANI, the percentage of exactly matching nucleotides, can be calculated based on all aligned regions of the whole genome alignment or based on just the aligned regions covered by specific annotation types. The former approach is similar to recent tools like OrthoANIu (3, 4) and fastANI (5), while the latter more closely resembles the original approach to ANI calculation (2).
An interactive viewer is provided for visualization and investigation of whole genome alignments created by the Create Whole Genome Alignment tool, or imported from an MAF or XMFA file.
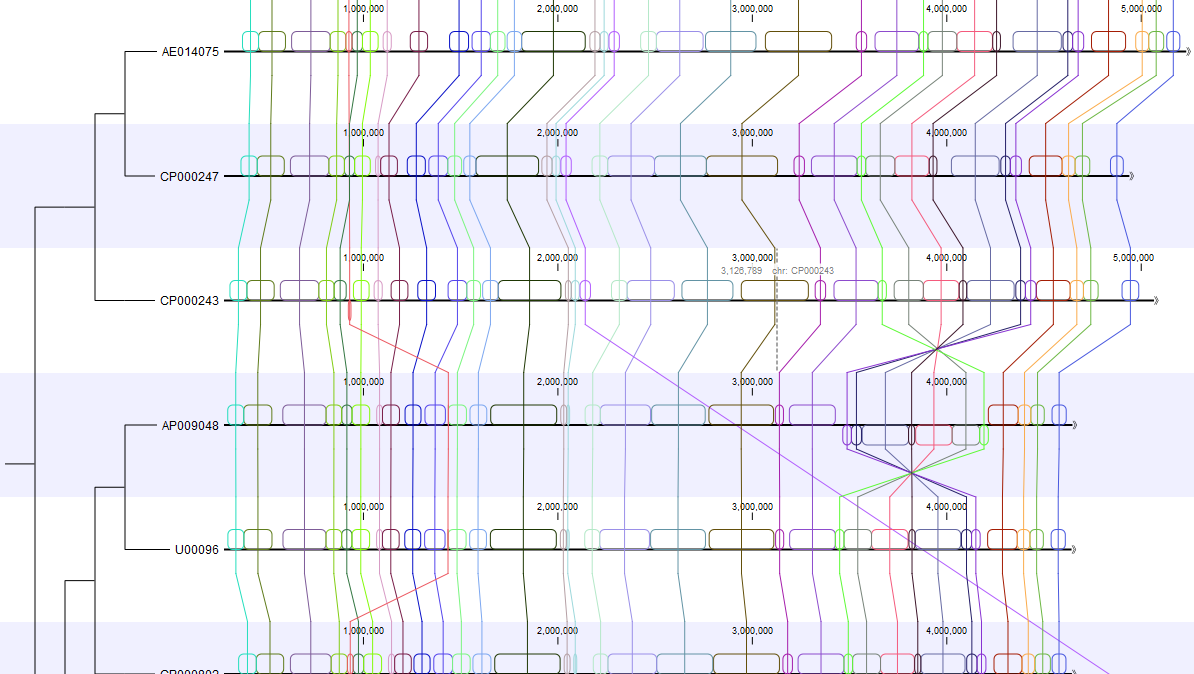
Each alignment block is shown as a colored box, with boxes drawn above the sequence indicating for aligned regions on the plus strand, and boxes below the sequence for aligned regions on the minus strand (Figure 1). Corresponding alignment blocks share the same color, and together can be thought of as an ordinary linear multiple sequence alignment, in that they do not contain internal rearrangements.

Figure 1 Visualizing a whole genome alignment using the CLC Workbench viewer. The alignment on the left is the large scale view. On the right is a region of the same alignment after zooming in. Here, CDS annotations are visible (in yellow), one of which has been selected.
Hovering the mouse cursor over an alignment block leads to corresponding alignment blocks being highlighted. Clicking on a particular position or annotation brings these corresponding blocks to the center of the view. Double-clicking an alignment block selects the regions covered by the connected alignment blocks.
Two tools are offered for visualizing genomic relationships represented by ANI values: Create Heatmap from Comparison and Create Tree from Comparison (Figure 2). To aid investigation of relationships between new sequences and well known genomes, metadata can be displayed, both user-defined metadata and also taxonomic metadata for sequences downloaded from NCBI.

Figure 2. Heat map (left) and tree (right) views of ANI values of 18 bacterial genomes, with genus metadata displayed.
The Create Whole Genome Dot Plot tool generates an initial overview of the similarities (homologous regions, translocations, inversions) between two genomes by making it easy to see the matching seeds (Figure 3).

Figure 3. A Whole Genome Dot Plot offers an overview of similarities (homologous regions, translocations, inversions) between two genomes.
Whole genome alignments can be exported to MAF and XMFA formats for use in downstream analyses. For comparative analyses requiring a multiple sequence alignment with no rearrangements, the Extract Multiple Sequence Alignment tool can be used. This tool traverses all aligned blocks of whole genome alignment and creates a linear, concatenated multiple sequence alignment, which can then be exported in, for example, Nexus format.
We provide benchmarks illustrating that tools provided by the Whole Genome Alignment plugin are comparable to other state-of-the-art methods.
The performance of the Create Whole Genome Alignment tool was evaluated using 27 simulated datasets made using sgEvolver (1). The simulated data was diverse and captured all simulation scenarios described in (1), with varied substitution, InDel, inversion and gene flux rates. We found that the Create Whole Genome Alignment tool alignments have nucleotide f-scores comparable to progressiveMauve, and is also generally much faster (Figure 4).

Figure 4. Performance of the Whole Genome Alignment plugin relative to progressiveMauve. Top: nucleotide f-score. Bottom: Running time in seconds on a log scale.
We downloaded a diverse set of 18 complete bacterial genomes and compared the ANI scores from the Create Average Nucleotide Identity Comparison tool to OrthoANIu and fastANI. The results are shown in figure 5. For highly similar pairs (ANI above 90%), these methods all produced similar results.

Figure 5. Performance of the alignment and ANI calculation tools of the Whole Genome Alignment plugin compared to OrthoANIu and fastANI ANI values. For each pair of genomes in the set of 18 genomes considered, OrthoANIu ANI values are plotted along the x-axis, with corresponding y-axis ANI values from fastANI (in red), and values from our implementation using the full set of aligned regions from the whole genome alignment (in blue), or only the aligned regions that were covered by CDS annotations (in green).Only genome pairs with an ANI of at least 80% from at least one method are shown.
The plugin is freely available and can be downloaded and installed directly on CLC Main Workbench or CLC Genomics Workbench via the Plugin Manager. Plugin files can also be downloaded from our plugins webpage for installation on the CLC Main Workbench, CLC Genomics Workbench or CLC Genomics Server.
(1) Darling, A. E., Mau, B., & Perna, N. T. (2010). progressiveMauve: multiple genome alignment with gene gain, loss and rearrangement. PloS one, 5, e11147.
(2) Konstantinidis, K. T., & Tiedje, J. M. (2005). Genomic insights that advance the species definition for prokaryotes. Proceedings of the National Academy of Sciences, 102, 2567-2572.
(3) Lee, I., et al. (2016). OrthoANI: an improved algorithm and software for calculating average nucleotide identity. International Journal of Systematic and Evolutionary Microbiology, 66, 1100-1103.
(4) Yoon, S. H., et al. (2017). A large-scale evaluation of algorithms to calculate average nucleotide identity. Antonie van Leeuwenhoek,110, 1281-1286.
(5) Jain, C., et al. (2018). High throughput ANI analysis of 90K prokaryotic genomes reveals clear species boundaries. Nature Communications, 9, 5114.