


The integration of viruses, retroviruses, transposable elements or vectors into host genomes is a central feature of genome biology and bioengineering. Molecular characterization of insertion sites is one of the most important steps for ensuring this integration is safe and as intended – and it’s also a powerful tool for genetic screening strategies. Current ways to characterize these insertion events include inverse PCR (iPCR), targeted locus amplification (TLA) and next-generation sequencing (NGS) hybridization capture.
The purpose of characterization is to find all vector integration events, including incomplete events like partial or rearranged sequences. Common methods of hybridization capture will iteratively map reads to the inserted sequence and then map the “unaligned” ends to the host genome. If applicable, they also record discordant read mates by mapping one read to the inserted sequence and the other to the host genome (ex. 1).
The CLC Identify Viral Integration Sites tool takes this a step further by supporting sequence capture enrichment protocols. These enrich for inserted sequences and capture chimeric reads and discordant paired reads. This tool has previously been used to identify human papillomavirus (HPV) integration sites (2).
Reads are mapped simultaneously against the host genome and a database of inserted virus or vector sequences. The Find Best References Using Read Mapping tool searches the database for the inserted sequence's best match to use as reference. By simultaneously mapping the reads to both virus and host genome, CLC can generate faster and more accurate results than with sequential mapping.
For reads that map to the host genome, unaligned ends are collected and mapped against the inserted sequence and vice versa. For broken read pairs that match the direction of the unaligned ends, the tool analyzes breakpoint information to identify host and virus reads. Users can customize these parameters for optimal sensitivity and specificity.
Let’s see how those tools perform with real data.
We used both Identify Viral Integration Sites and Find Best References Using Read Mapping to identify integration sites in the genome of Arabidopsis thaliana. This data was sourced from Illumina PE read NGS data of sequence capture probes from the T-DNA produced by Inagake et al. (3). Identified integration sites were verified by PCR in the original study. Sun et al. reanalyzed the data with new bioinformatic tools and found evidence of additional T-DNA integration sites. Many of these integration events were scrambled or partial.
CLC precisely identified the original PCR-verified pCAMBIA3300 integrations reported by Inagake et al. (Table 1, yellow), using the TAIR10 Arabidopsis host genome reference. It also identified the additional T-DNA integration sites from the more sophisticated reanalysis by Sun et al. (Table 1, green). Finally, CLC detected ten new integration sites (Table 1, blue), which creates a better resolution of local integration events and provides a more comprehensive characterization of the global integration landscape.
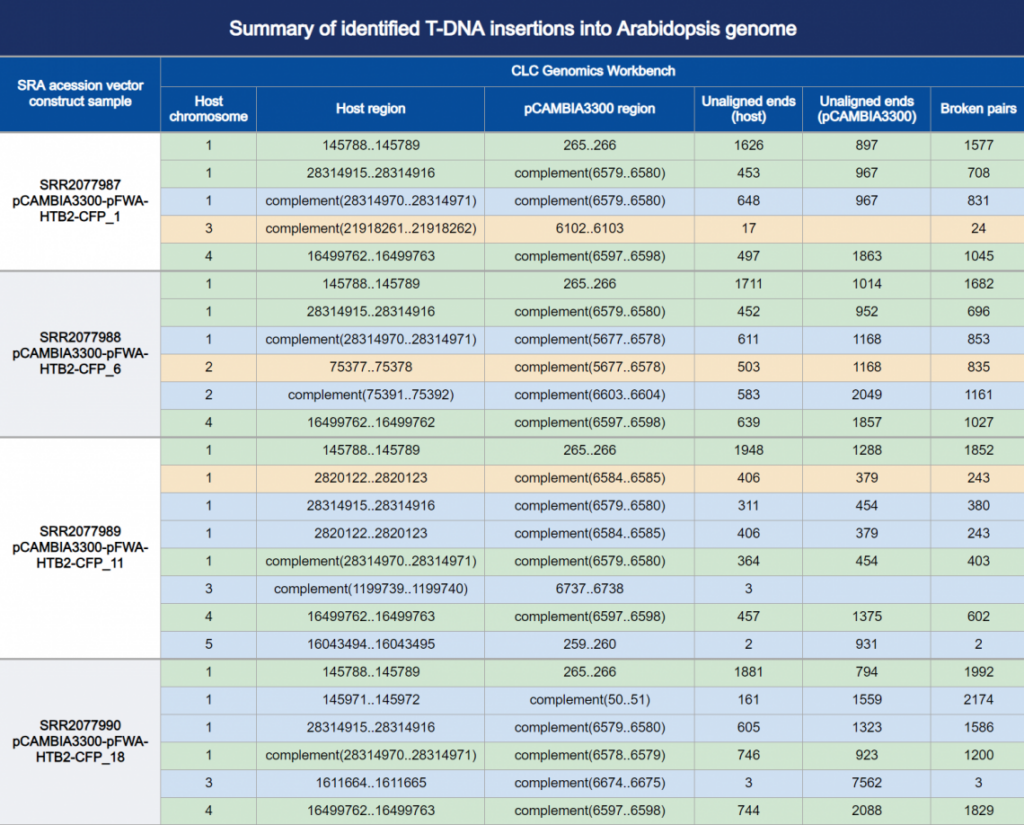
Table 1. Summary of the called insertions, their orientation, and the underlying supporting evidence. Read mappings to the inserted genome and to the host genome are also available (Figure 1 & 2). A circos plot provides a graphical interactive rendition of the table and the read mappings, where the concentric layers show coverage, broken pairs, unaligned ends and their starting points (Figure 3 & 4).
By using the right tools, you can accurately identify the T-DNA sequence, precise breakpoints, variants and rearrangements – without worrying that you could be missing sites. This helps you ensure that your work stays regulation-compliant, with all the genetic modifications characterized at molecular level.
Iterative mappings, read extractions, de novo assemblies and realignments to vector and host genomes allow you to reconstruct the integration events at identified sites. They cut through non-clean, partial and scrambled integration events that rearrange the genomic context, creating a complete picture ready for analysis. With its suite of advanced NGS analysis tools, CLC Genomics Workbench Premium remains the clear choice for safe, effective and efficient research.
Curious about how CLC can help your genomics research?
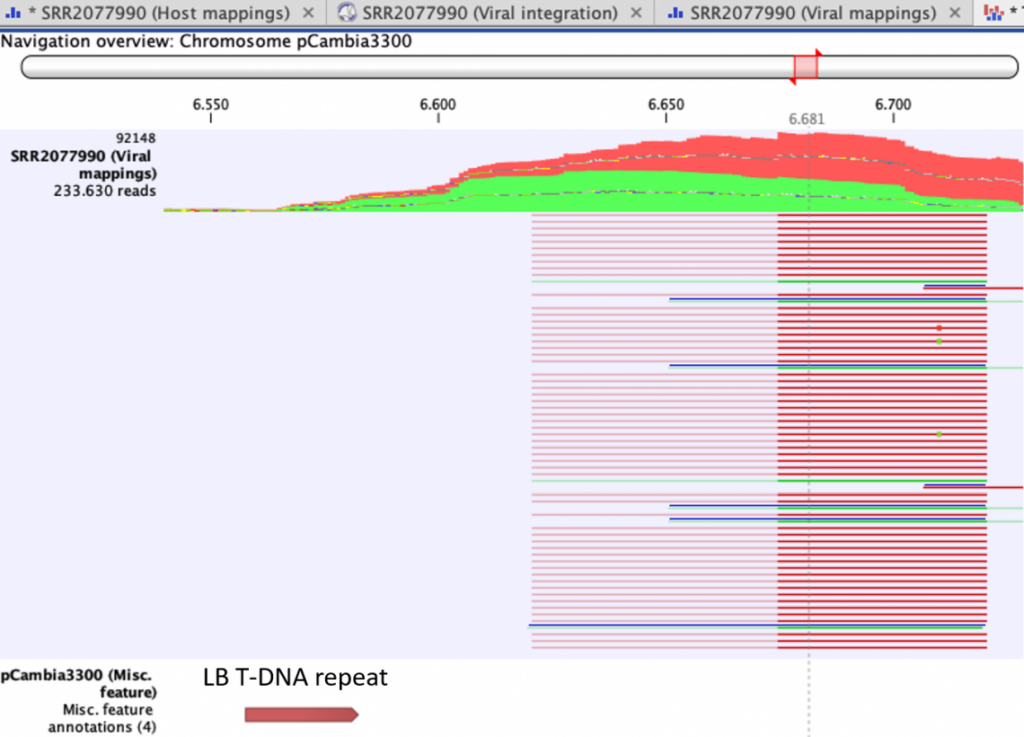
Figure 1. Read mapping to inserted genome of sample SRR2077990 pCAMBIA3300-pFWA-HTB2-CFP_18, near the Left Border Repeat of the T-DNA, showing unaligned ends originating from the host genome.
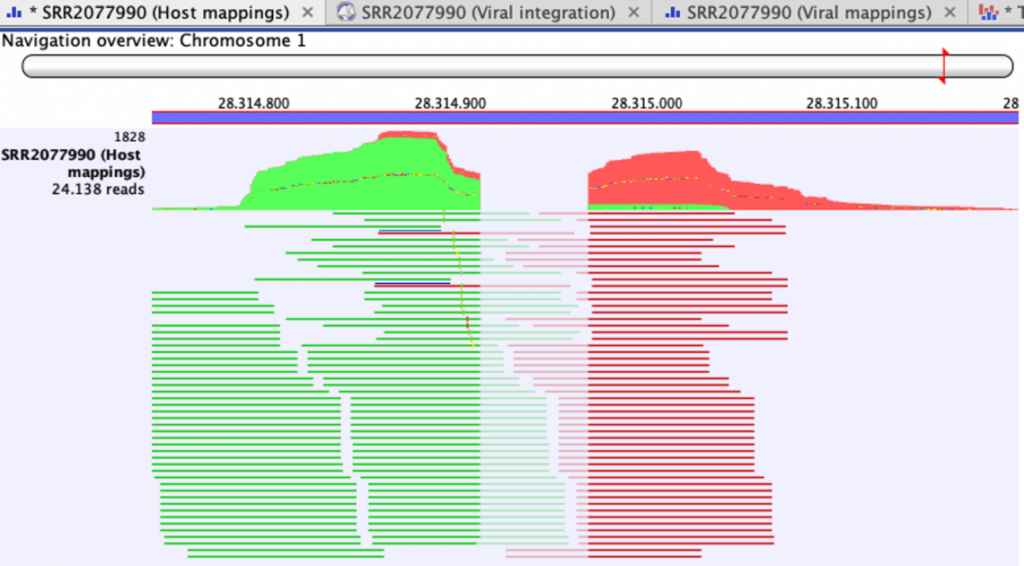
Figure 2. Read mapping to host genome of sample SRR2077990 pCAMBIA3300-pFWA-HTB2-CFP_18, at two integration sites of the Left Border Repeat of the T-DNA (Chr1 28314915 and, in the opposite direction, 28314970), showing unaligned ends originating from the T-DNA.
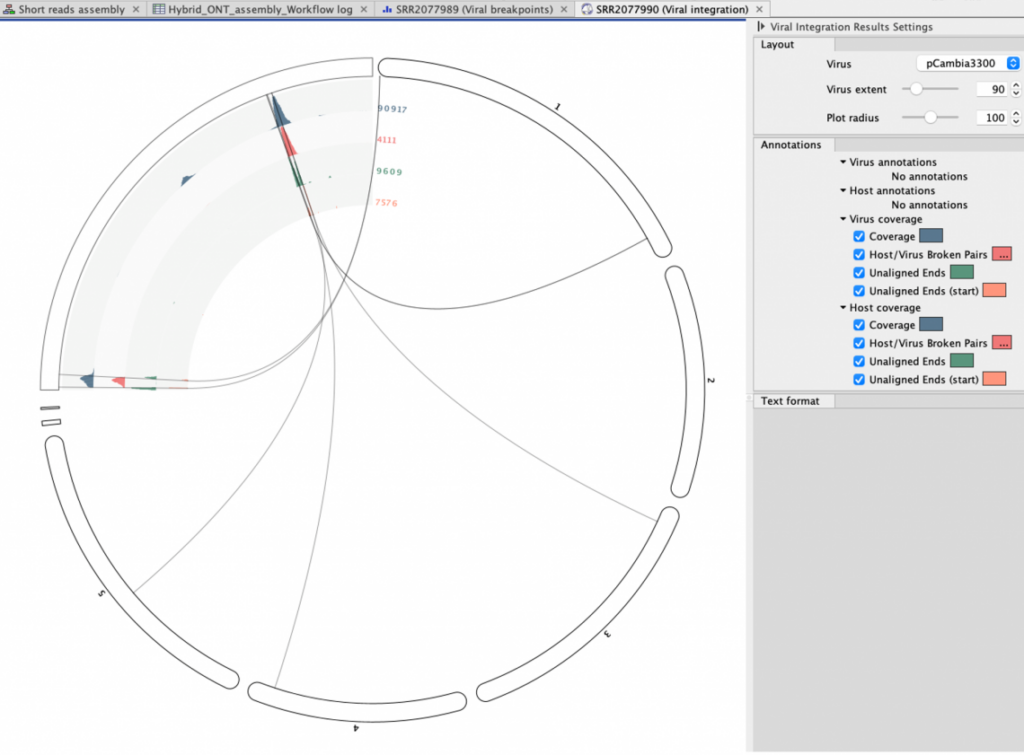
Figure 3. Circos plot of the insertion site calls in sample SRR2077990 pCAMBIA3300-pFWA-HTB2-CFP_18, with concentric layers showing coverage, broken pairs, unaligned ends and their starting points.
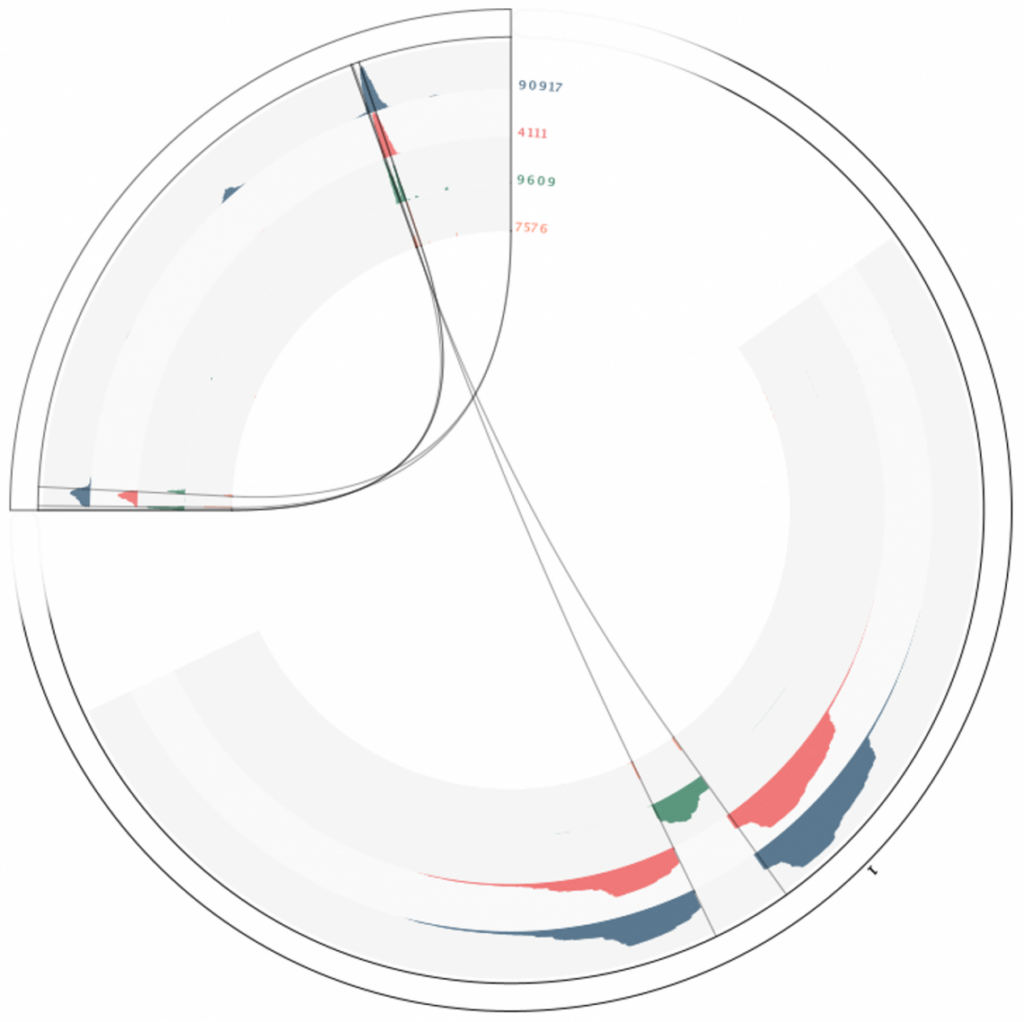
Figure 4. Circos plot of the insertion site calls in sample SRR2077990 pCAMBIA3300-pFWA-HTB2-CFP_18, at positions Chr1 28314915 and, in the opposite direction, 28314970. 28314970 is the same region as shown in figures 1 and 2 for the insert and host genomes, respectively, with concentric layers showing coverage, broken pairs, unaligned ends and their starting points.