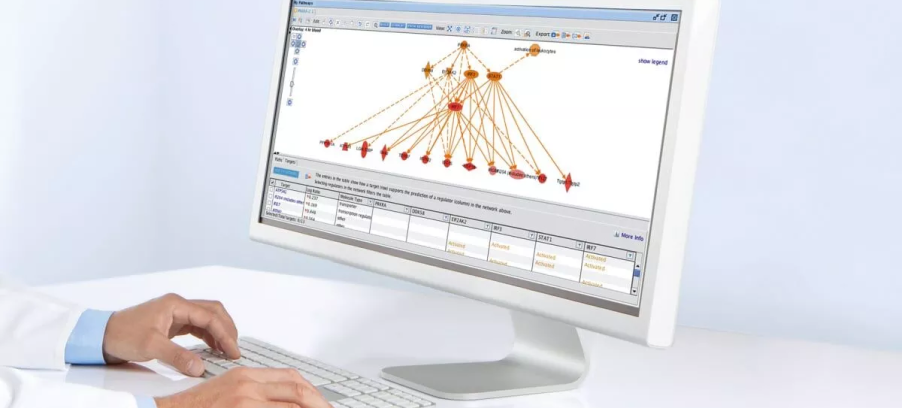
QIAGEN Ingenuity Pathway Analysis (QIAGEN IPA)
Quickly visualize and understand complex ‘omics data and perform insightful data analysis and interpretation by placing your experimental results within the context of biological systems.
See what’s new in the – IPA Fall Release (October 2023)

Home > Bioinformatics Products Overview > Bioinformatics Tools and Applications > Genomics Data Analysis Software > Ingenuity Pathway Analysis
Analyze. Compare. Contextualize.
Porta felis scelerisque quis pretium in dignissim condimentum. Egestas adipiscing morbi eu purus tristique cursus. Nec sit sollicitudin vitae tristique nunc iaculis tellus quisque purus. Ultricies pulvinar dui tortor sed ut vitae sed aliquam tristique. Sagittis tristique aliquam id vel.
Understand complex 'omics data to accelerate your research
Discover why QIAGEN Ingenuity Pathway Analysis (IPA) is the leading pathway analysis application among the life science research community and is cited in tens of thousands of articles for the analysis, integration and interpretation of data derived from ‘omics experiments. Such experiments include:
- RNA-seq
- Small RNA-seq
- Metabolomics
- Proteomics
- Microarrays including miRNA and SNP
- Small-scale experiments
With QIAGEN IPA you can predict downstream effects and identify new targets or candidate biomarkers. QIAGEN Ingenuity Pathway Analysis helps you perform insightful data analysis and interpretation to understand your experimental results within the context of various biological systems.
Insightful data analysis and interpretation
Data analysis and interpretation with QIAGEN IPA is built on the most comprehensive, manually curated content of the QIAGEN Knowledge Base to help scientists like you understand the biological context of your expression analysis experiments. Powerful algorithms, combined with rich content, provide unique advanced analysis capabilities to help you identify the most significant pathways, whether they are activated or inhibited, and discover potential novel regulatory networks and causal relationships associated with your experimental data.
'Omics data analysis
Porta felis scelerisque quis pretium in dignissim condimentum. Egestas adipiscing morbi eu purus tristique cursus. Nec sit sollicitudin vitae tristique nunc iaculis tellus quisque purus. Ultricies pulvinar dui tortor sed ut vitae sed aliquam tristique. Sagittis tristique aliquam id vel.
Compare your analysis to over 100,000 published analyses
Analysis Match – discover why it’s the most valuable feature of QIAGEN IPA
Automatically match your analyses against over 100,000 curated publicly available datasets and any previous experiments you wish to include. Compare results, validate interpretation and better understand causal connections between and among diseases, genes and networks of upstream regulators. Strengthen hypotheses and discover new biological insights by combining an enormous compendium of knowledge from the literature with a massive collection of gene expression measurements. Analysis Match – discover why this is the most valuable feature of QIAGEN IPA
Contextualize your findings with a massive collection of 'omics data
QIAGEN IPA now offers contextually relevant links to QIAGEN OmicSoft Land Explorer, a database of curated disease ‘omics data with over 500,000 samples. With this new premium tier of IPA, you can explore ‘omics data for individual genes as well as expression correlation across multiple genes with robust visualizations. Jump from a gene of interest in QIAGEN IPA to discover its tissue or cell expression. Explore the diseases and treatment contexts in which it is up-or-down-regulated. Visualize how mutations correlate with changes in expression, the effect of mutations on clinical outcomes and much more. Access to OmicSoft Land Explorer through IPA requires additional licensing.
Further details on the integration of QIAGEN IPA with QIAGEN OmicSoft Land Explorer can be found here.
Go beyond pathway analysis
QIAGEN Ingenuity Pathway Analysis lets you go beyond pathways and explore other facets of your data through Advanced Analytics and now comes standard on all QIAGEN IPA subscriptions. Causal Network Analysis exposes causal relationships associated with your experimental data by expanding upstream analysis to include regulators not directly connected to targets in your dataset. The BioProfiler helps you identify potential therapeutic or toxicity targets, and associated known drugs and biomarkers. IsoProfiler help you identify specific isoforms with specific biological properties.
Let's reshape the future of biological data analysis
QIAGEN IPA educational teaching licenses
Want to develop a stellar teaching curriculum to help your students master biological data analysis? With our teaching license package to QIAGEN IPA, you can design and tailor a comprehensive syllabus to provide your students with valuable hands-on experience and proficiencies that’ll set them up for success in their research careers.
Explore other valuable features of QIAGEN IPA:
Causal Network Analysis
Generates multi-level regulatory networks that may explain the gene expression changes exhibited in a dataset. This tool enables the discovery of novel regulatory mechanisms by expanding upstream analysis to include regulators not directly connected to targets in the dataset.
IsoProfiler
Identify and prioritize isoforms with interesting biological properties. Find genes with RNA transcripts having unusual pattern(s) of expression such as isoform switching or associated with known diseases or functions. Use the fully-integrated human GTEx expression data to identify transcripts with known tissue-specific expression. Visualize isoform-level expression in one or multiple datasets.
Regulator Effects
Provides insights into your data by integrating Upstream Regulator results with Downstream Effects results to create causal hypotheses that explain what may be occurring upstream to cause particular phenotypic or functional outcomes downstream.
Discover more
Related resources:
Molecule Activity Predictor (MAP)
Interrogate sub-networks and Canonical Pathways and generate hypotheses by selecting a molecule of interest, indicating up or down regulation and simulating directional consequences of downstream molecules and the inferred activity upstream in the network or pathway.
Ready to discover how QIAGEN IPA is right for you? Request a consultation today.
If you already have an active QIAGEN IPA license, access your license quickly by installing the QIAGEN IPA client on your computer.

Related bioinformatics solutions
System Requirements
Windows Operating Systems:
- Windows 10
- Windows 8
- Windows 7
- Windows XP SP2 or later*
Windows Internet Browsers:
- Microsoft Edge 87 or later
- Firefox 5 or later
- Chrome 10 or later
- Safari 5.05 or later
Java Runtime Environment (JRE).
Not needed if using the installed version of the QIAGEN IPA client **:
- JRE 1.8.0_xx or higher
Minimum Hardware Requirements:
- CoreTM i5 processor or equivalent running at 2 GHz or higher with 64 bit OS and Java
- Minimum at least 3 GB RAM free for Java
- Minimum Screen resolution of 1280×800
* Note: Due to Microsoft discontinuing support for the Windows XP operating system in April of 2014, the Ingenuity Apps Team at QIAGEN transitioned to legacy support for QIAGEN IPA on XP starting with the Spring release in March 2014. QIAGEN IPA will continue to function on the XP operating system and we anticipate no issues. However, we recommend that you upgrade to a newer operating system as soon as possible. With this reduced support for XP the QIAGEN IPA team will continue to investigate any reported defects and attempt to offer work-arounds for any identified issues if they arise due to XP.
Mac Operating Systems
- macOS Big Sur
- macOS Catalina
- macOS Mojave
Internet Browsers
- Firefox 5 or later
- Safari 5.0.5 or later
- Chrome 10 or later
We recommend that you install the QIAGEN Ingenuity Pathway Analysis client using the IPA installer located here: https://analysis.ingenuity.com/pa/installer/select
With the IPA installer, you no longer need to install Java separately or login to QIAGEN IPA with a web browser. There is no offline mode for QIAGEN IPA, you need an internet connection to use it.
**JRE is the acronym for the Java Runtime Environment and is the program required to run Java applications and applets on your computer. Java is not needed if using the installed version of the QIAGEN IPA client.
*** Lightweight usage of QIAGEN IPA includes search, build/overlay operations and small dataset upload and analysis creation. For larger analyses and comparison analyses, QIAGEN IPA requires more memory (RAM).


