


Latest improvements for IPA
What’s New in the IPA Fall Release (September 29th, 2024)
New RNA-seq Analysis Portal, included with Analysis Match Explorer licenses
Take the stress out of data analysis and fast-track your path to gene expression insights with our new RNA-seq Analysis Portal. Go from FASTQ files to pathway analysis insights in hours instead of days. The portal supports analyses for 20 species using proven, published algorithms.
The QIAGEN RNA-seq Analysis Portal is compatible with QIAseq and other major RNA library kits from companies such as Illumina, Thermo Fisher, NEB, and others so you can process FASTQ files from SRA, BaseSpace, or from your local storage. After uploading or transferring the data to the cloud (AWS) with the portal’s web interface, you can process and QC the data, then push the differential expression data directly to your IPA account for biological interpretation.
The portal is included for any user with an “Analysis Match Explorer” license (access to Analysis Match and Land Explorer). The link to the portal is titled “Process RNA-seq data” and can be found at the top right of the IPA UI, as shown in Figure 1.
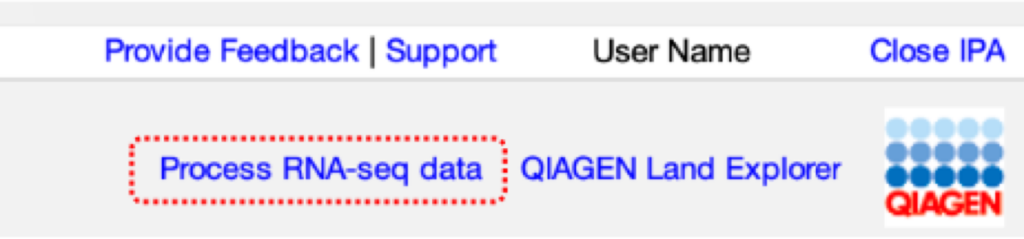
Figure 1. Link to the RNA-seq Analysis Portal. The link titled “Process RNA-seq data” is shown highlighted with a dotted red box. It is available to those who have access to Analysis Match plus Land Explorer in IPA.
The portal guides you through three simple steps to process and view your data, as shown in Figure 2. If you want to download BaseSpace data or a study from SRA, skip to Step 2.
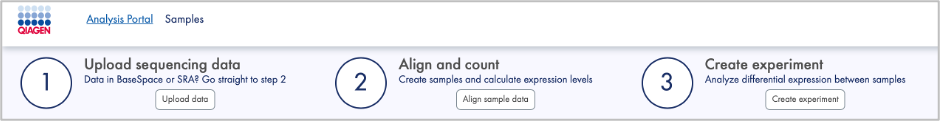
Figure 2. Three simple steps to process your RNA-seq data. 1) Upload, 2) align and count, and 3) create the experiment by defining how to ratio the samples to create differential expression values.
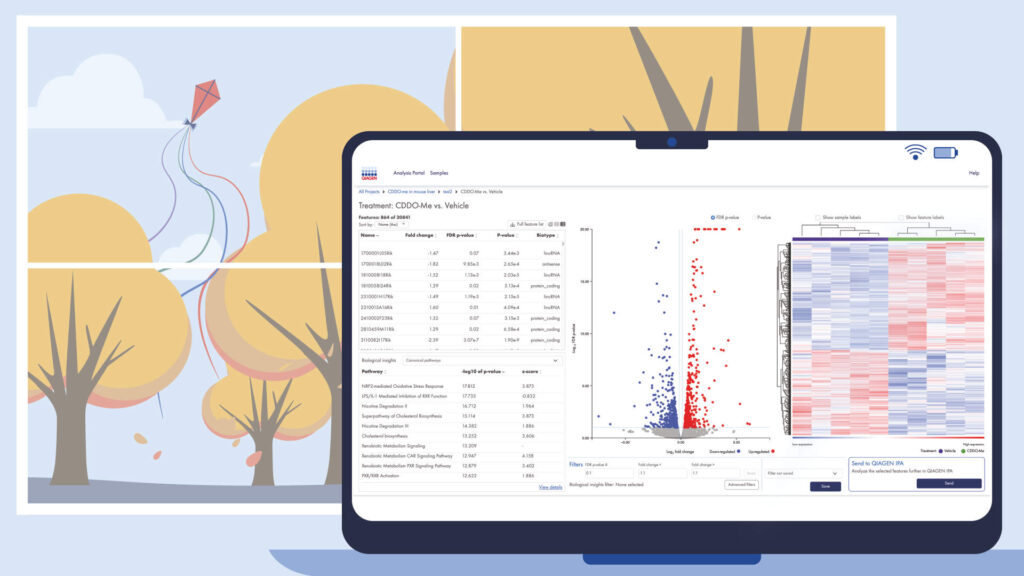
Once the steps are completed, you can view the experiment(s), as shown in Figure 3. In IPA terms, each “experiment” is a single dataset consisting of one IPA “observation”.
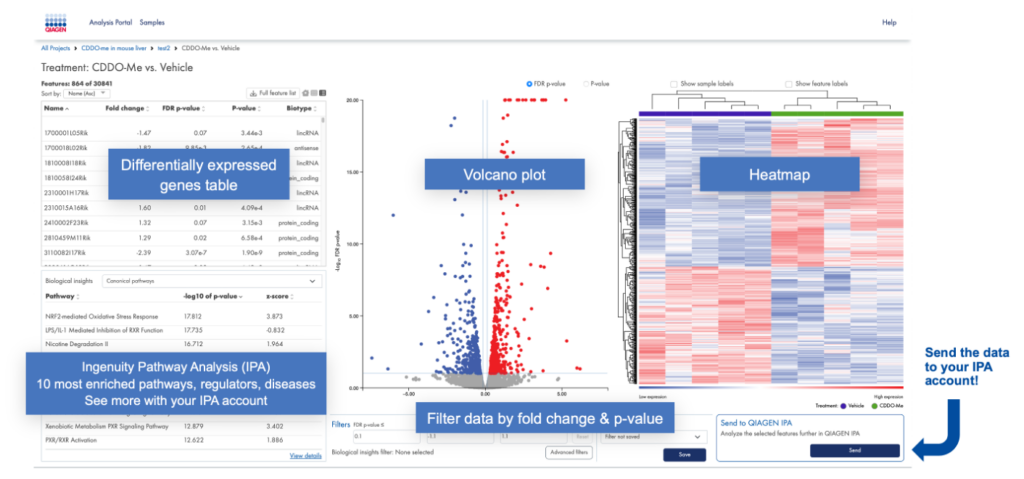
Figure 3. Annotated view of the RNA-seq portal “experiment view”. Once you’ve aligned your samples to the genome for the species of interest and assigned samples to groups (such as treatment type), you can visualize the differentially expressed genes in a heat map and volcano plot as shown. After setting cutoffs, you can then send the data to your IPA account for biological analysis.
The portal also provides QC tools to help you check whether the data quality is acceptable for further analysis. One such tool is a PCA plot (Figure 4) that enables a quick assessment of whether the expression levels in the samples are characteristic of the group labels you gave them.
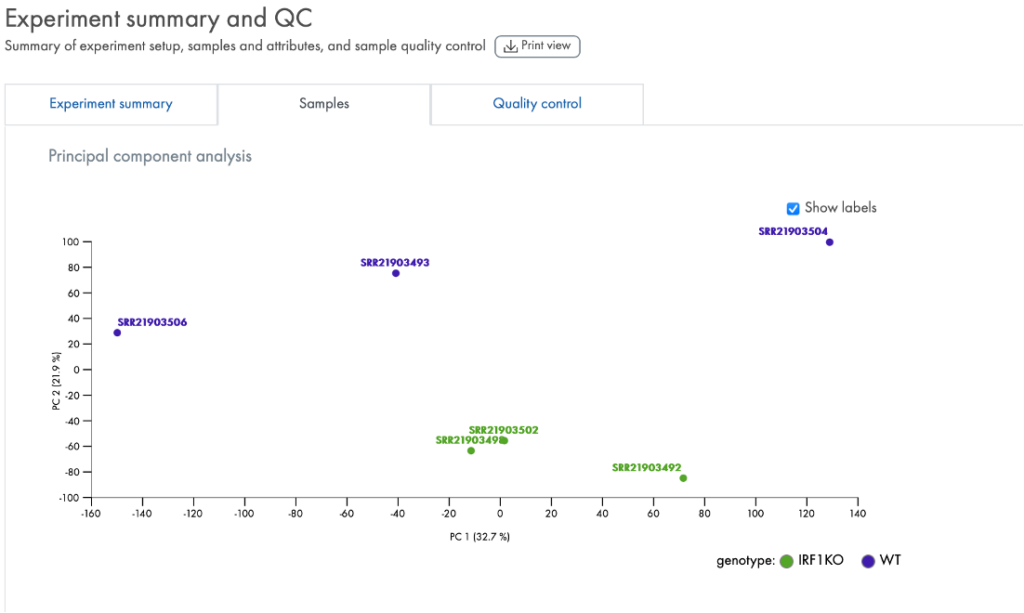
Figure 4. PCA (Principal Component Analysis). Each sample is labeled with the key attribute that you used to assign them into groups. Ideally, as in this instance for “genotype”, the samples clearly cluster by their genotype. The PCA results can indicate if the samples truly have a difference in RNA expression levels driven by the group difference, such as whether IRF1 is knocked out as in this example (data derived from GSE215771).
Other QC tools in the portal break out the mapping by genomic region, such as by intron, exon, or intergenic regions, by biotype (Figure 5), or by the taxonomic profile of contaminating organisms, if any (Figure 6).
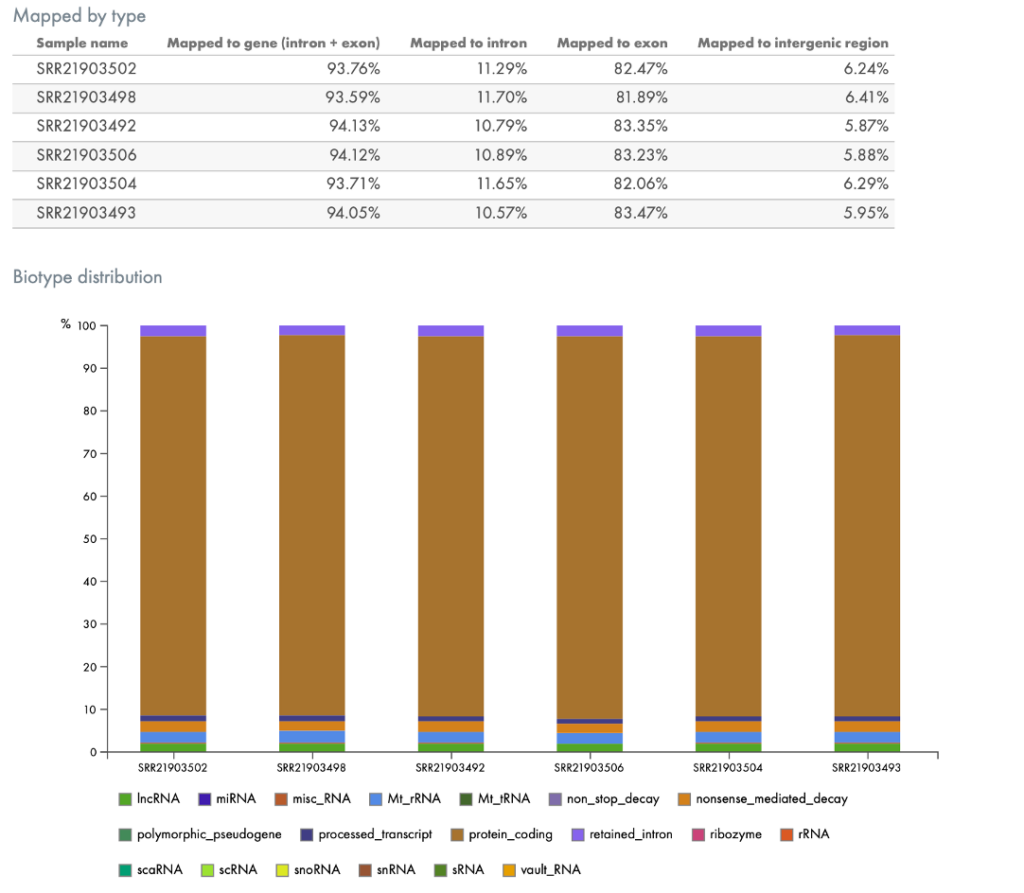
Figure 5. Mapping of RNA by genomic region (top) or by biotype (bottom). The portal automatically provides QC metrics such as metrics describing where in the genome (broadly speaking) the reads were mapped (top) and to what type of RNA, such as protein coding regions or to lncRNA (bottom).
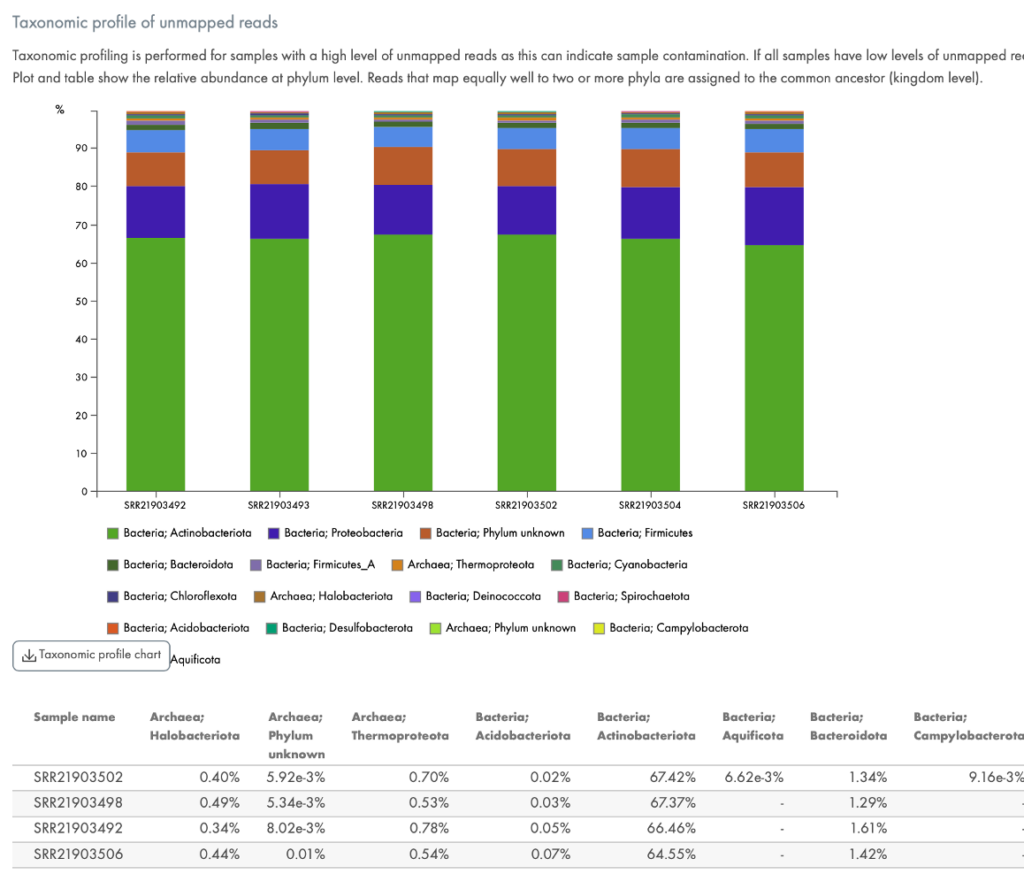
Figure 6. Quantification of contaminating RNA. If your samples are contaminated with bacterial sequences, this chart will be provided to quantitate the type of bacteria.
You can share the data with others, create Venn diagrams of overlapping differentially expressed gene sets (if you have multiple experiments), and send the data to IPA for analysis. You can either send the data to IPA without starting an analysis or create cutoffs and start an IPA Core Analysis within the portal.
With the new RNA-seq Analysis Portal, it is incredibly easy to get your RNA-seq data processed, QC’d, and sent to IPA. This takes one to two hours in total, with only a few minutes of hands-on time.
If you don’t have an Analysis Match Explorer license with the included RNA-seq Analysis Portal, please contact your local IPA administrator or an IPA salesperson at bioinformaticssales@qiagen.com.
Revised ortholog clustering
A major change has been made to ortholog composition in IPA. Up until this release, the definition of which genes are included in each ortholog came from the NCBI source HomoloGene. This source stopped being updated in 2014 in favor of a new method in their NCBI Eukaryotic Genome Annotation Pipeline.
IPA has now been updated to use this new system, which changed the definitions of about 10% of all IPA's orthologs. The new ortholog definitions are superior to the older ones and are more current.
For orthologs that were changed, the old ortholog will be "deprecated" in favor of the new ortholog in older analyses. This has significant implications on older analyses run before this content update. The changes in the content are explained in detail in this help article.
The most straightforward way to take advantage of these improvements is to re-run the analysis of interest (right-click on the analysis and choose “Re-run Analysis”).
Bubble chart improvement
When you customize the Canonical Pathway bubble chart to color the bubbles by pathway category, the Reactome Pathways are colored separately from Ingenuity Signaling and Metabolic pathways, as shown in Figure 7 below.
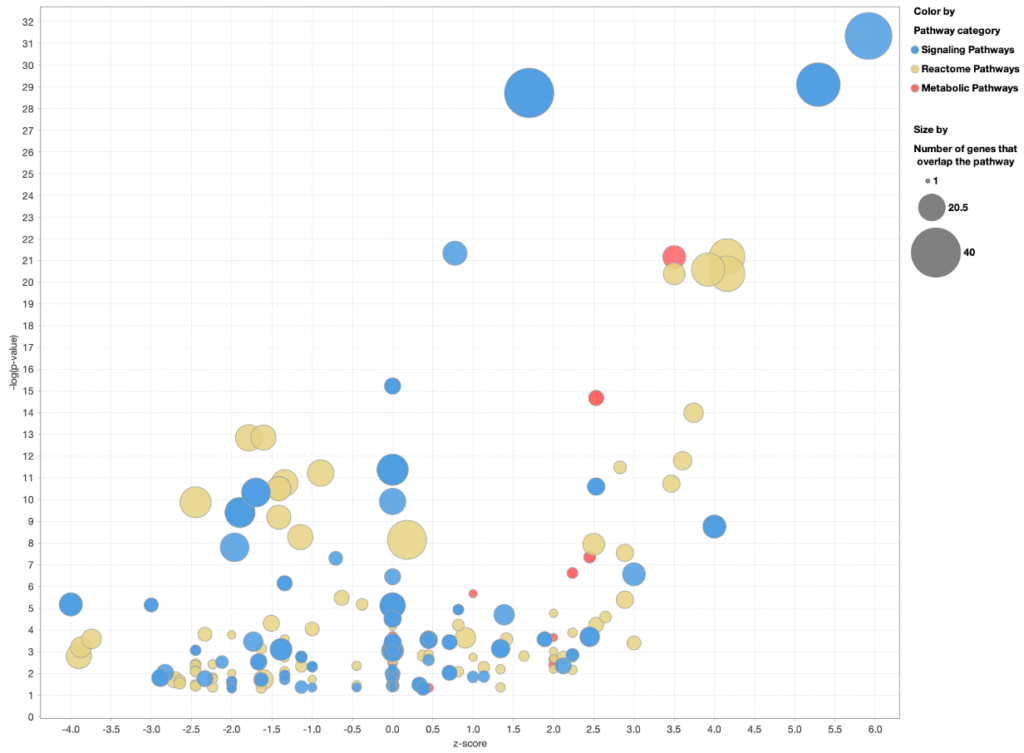
Figure 7. Coloring a Canonical Pathway bubble chart by pathway category. The Reactome pathways are now colored differently than Ingenuity Signaling and Metabolic Pathways.
Content updates
11 new Ingenuity signaling pathways
- Cyclophilin Signaling Pathway
- Glycation Signaling Pathway
- Hepatitis B Chronic Liver Pathogenesis Signaling Pathway
- Irritable Bowel Syndrome Signaling Pathway
- Lung Ionic Balance Signaling Pathway
- Mitochondrial Division Signaling Pathway
- mRNA 3 Prime End Processing Signaling Pathway
- NAP1L1 Transcription Regulation Signaling Pathway
- Ribosomal Quality Control Signaling Pathway
- Sheddase Signaling Pathway
- TRIM21 Intracellular Antibody Signaling Pathway
54 new Reactome pathways
- Cardiogenesis
- Cellular response to mitochondrial stress
- Chromatin modifications during the maternal to zygotic transition (MZT)
- Chromatin organization
- Citric acid cycle (TCA cycle)
- Complex I biogenesis
- Complex III assembly
- Complex IV assembly
- Formation of ATP by chemiosmotic coupling
- Formation of intermediate mesoderm
- Formation of the anterior neural plate
- Formation of the nephric duct
- Formation of the posterior neural plate
- Formation of the ureteric bud
- Inositol phosphate metabolism
- Interconversion of 2-oxoglutarate and 2-hydroxyglutarate
- Lysosomal oligosaccharide catabolism
- Malate-aspartate shuttle
- Maturation of TCA enzymes and regulation of TCA cycle
- M-decay: degradation of maternal mRNAs by maternally stored factors
- MITF-M-dependent gene expression
- Mitochondrial protein degradation
- Mitochondrial RNA degradation
- Mitochondrial Uncoupling
- Nephron development
- NFE2L2 regulating ER-stress associated genes
- NFE2L2 regulating inflammation associated genes
- NFE2L2 regulating MDR associated enzymes
- NFE2L2 regulating tumorigenic genes
- Nucleotide biosynthesis
- Paracetamol ADME
- PKR-mediated signaling
- Post-translational modification: synthesis of GPI-anchored proteins
- Protein lipoylation
- Protein repair
- Pyruvate metabolism
- Regulation of CDH11 Expression and Function
- Regulation of CDH19 Expression and Function
- Regulation of endogenous retroelements
- Replacement of protamines by nucleosomes in the male pronucleus
- Respiratory electron transport
- Ribavirin ADME
- rRNA modification in the nucleus and cytosol
- Sialic acid metabolism
- Signaling by LTK
- Signaling by TGFBR3
- SLC15A4:TASL-dependent IRF5 activation
- Somitogenesis
- Specification of primordial germ cells
- Specification of the neural plate border
- Transcriptional and post-translational regulation of MITF-M expression and activity
- Transcriptional regulation of brown and beige adipocyte differentiation
- Z-decay: degradation of maternal mRNAs by zygotically expressed factors
- Zygotic genome activation (ZGA)
New GWAS Findings
Over 60,000 findings from the NHGRI-EBI Catalog from human genome-wide association studies have been brought into IPA. All relationships that could be assigned to genes (as opposed to variants in intergenic regions) are now available under the existing source in IPA called “An Open Access Database of Genome-wide Association Results”. The ~2,000 findings from 2009 that were held there previously have been removed as they were not curated under the current protocol.
Figure 8 shows an example of a small network in IPA built using some of these GWAS findings.
Figure 8. Examples of new GWAS relationships in IPA. Only associations with p-values less than or equal to 1e-05 were imported. The specific p-values for a finding will be displayed in a future IPA release.
Machine learning disease pathway updates
The ML disease pathways have been recomputed with optimizations, new content, and new ortholog definitions.
Summary of all new findings
More than 290,000 new findings:
- >141,600 Expert findings (from literature curation)
- >60,000 GWAS findings from the NHGRI-EBI Catalog of human genome-wide association studies
- >41,000 protein-protein interaction findings from BioGrid
- >30,000 gene-to-disease findings from COSMIC
- >19,400 cancer mutation findings from ClinVar
- >11,200 protein-protein interaction findings from IntAct
- >3,400 gene-to-disease findings from the Online Inheritance in Man (OMIM)
- >3,000 target-to-disease findings from ClinicalTrials.gov
- >2,000 drug-to-disease findings from ClinicalTrials.gov
- >1,600 Gene Ontology findings
- >168 findings from Clinical Genome Resource (ClinGen)
- >200 newly mappable chemicals
OmicSoft datasets
215,968 datasets from OmicSoft in total will be available in late October 2024.
| Land | Repository | Datasets Q1 2024 | Datasets Q3 2024 | Increase |
|---|---|---|---|---|
| DiseaseLand | HumanDisease | 36,105 | 38,266 | 2161 |
| MouseDisease | 26,892 | 28,403 | 1511 | |
| RatDisease | 9287 | 10,264 | 977 | |
| LINCS | 29,976 | 25,880 | -4096 | |
| OncoLand | OncoHuman | 22,219 | 24,636 | 2417 |
| OncoMouse | 1054 | 1516 | 462 | |
| TCGA | 4854 | 4854 | 0 | |
| ENCODE RNA Binding | 486 | 486 | 0 | |
| ClinicalProteomicTumor | 628 | 2129 | 1501 | |
| Single Cell Land | SingleCellHuman | 194 | 194 | 0 |
| SingleCellHumanUmi | 53,046 | 63,336 | 10,290 | |
| SingleCellHumanHCL | 1469 | 1476 | 7 | |
| SingleCellMouse | 81 | 81 | 0 | |
| SingleCellMouseUmi | 11,033 | 13,135 | 2102 | |
| Normal Cells and Tissues | Human Tissues (GTEx) | 1312 | 1312 | 0 |
Note that ~4,000 LINCS control datasets that had been included inadvertently have now been removed.