
CLC Genomics Workbench 9.5
With the latest release of CLC Genomics Workbench we continue to enhance your data analysis experience
Release Highlights
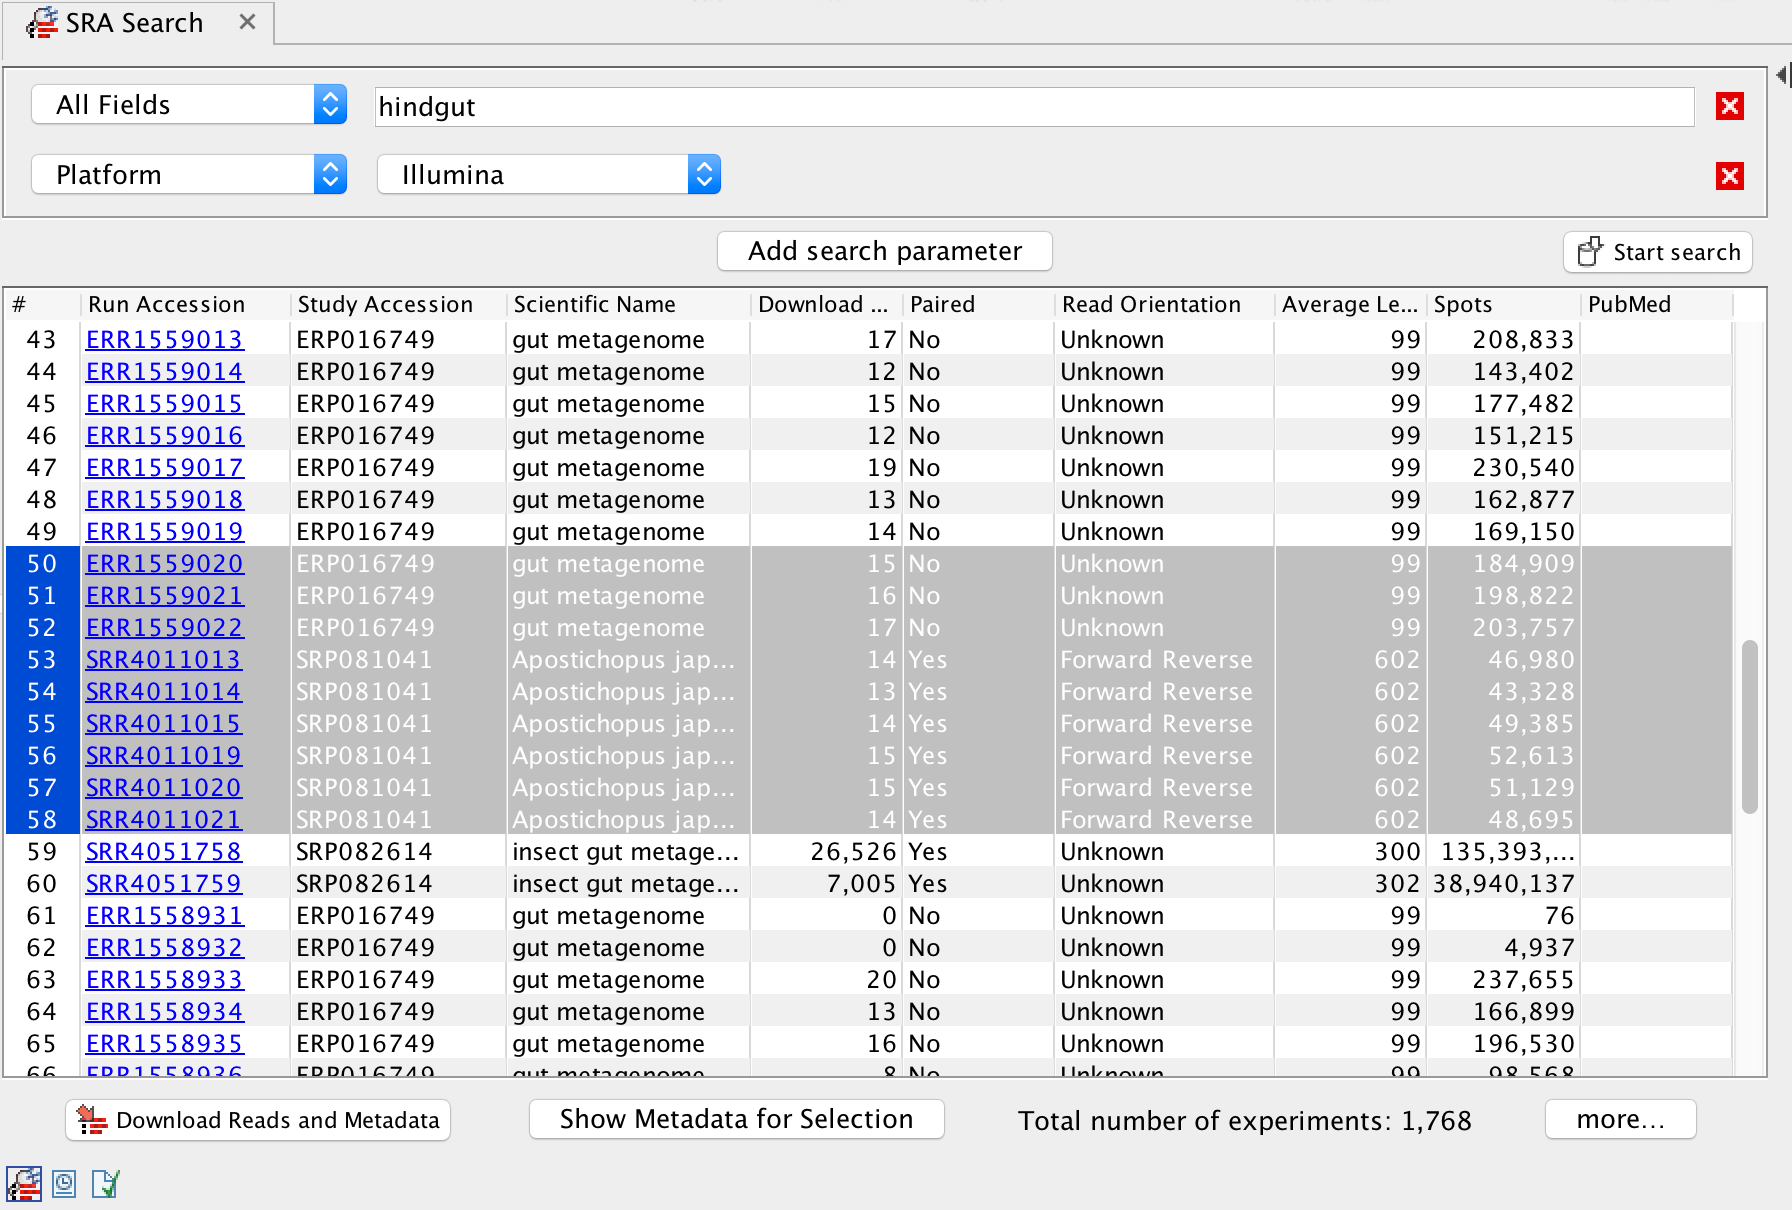
SRA Download
Boost your research by making project-level management of data and metadata easier. The new SRA-download features integrate into NCBI SRA, the largest archive of next-generation sequencing datasets.
- Powerful new search feature under the Download menu. Cast a wide search, e.g. by organism, data type, or disease. Then narrow down your search and filter for dates or other information found in the SRA or abstracts.
- Search or filter by Run-, Experiment-, Study-, or Sample Accession numbers.
- More meaningful data interpretation through metadata. SRA metadata are linked to downloaded reads and are available for statistics and visualizations.
- Maximize data transfer rates through Aspera support.
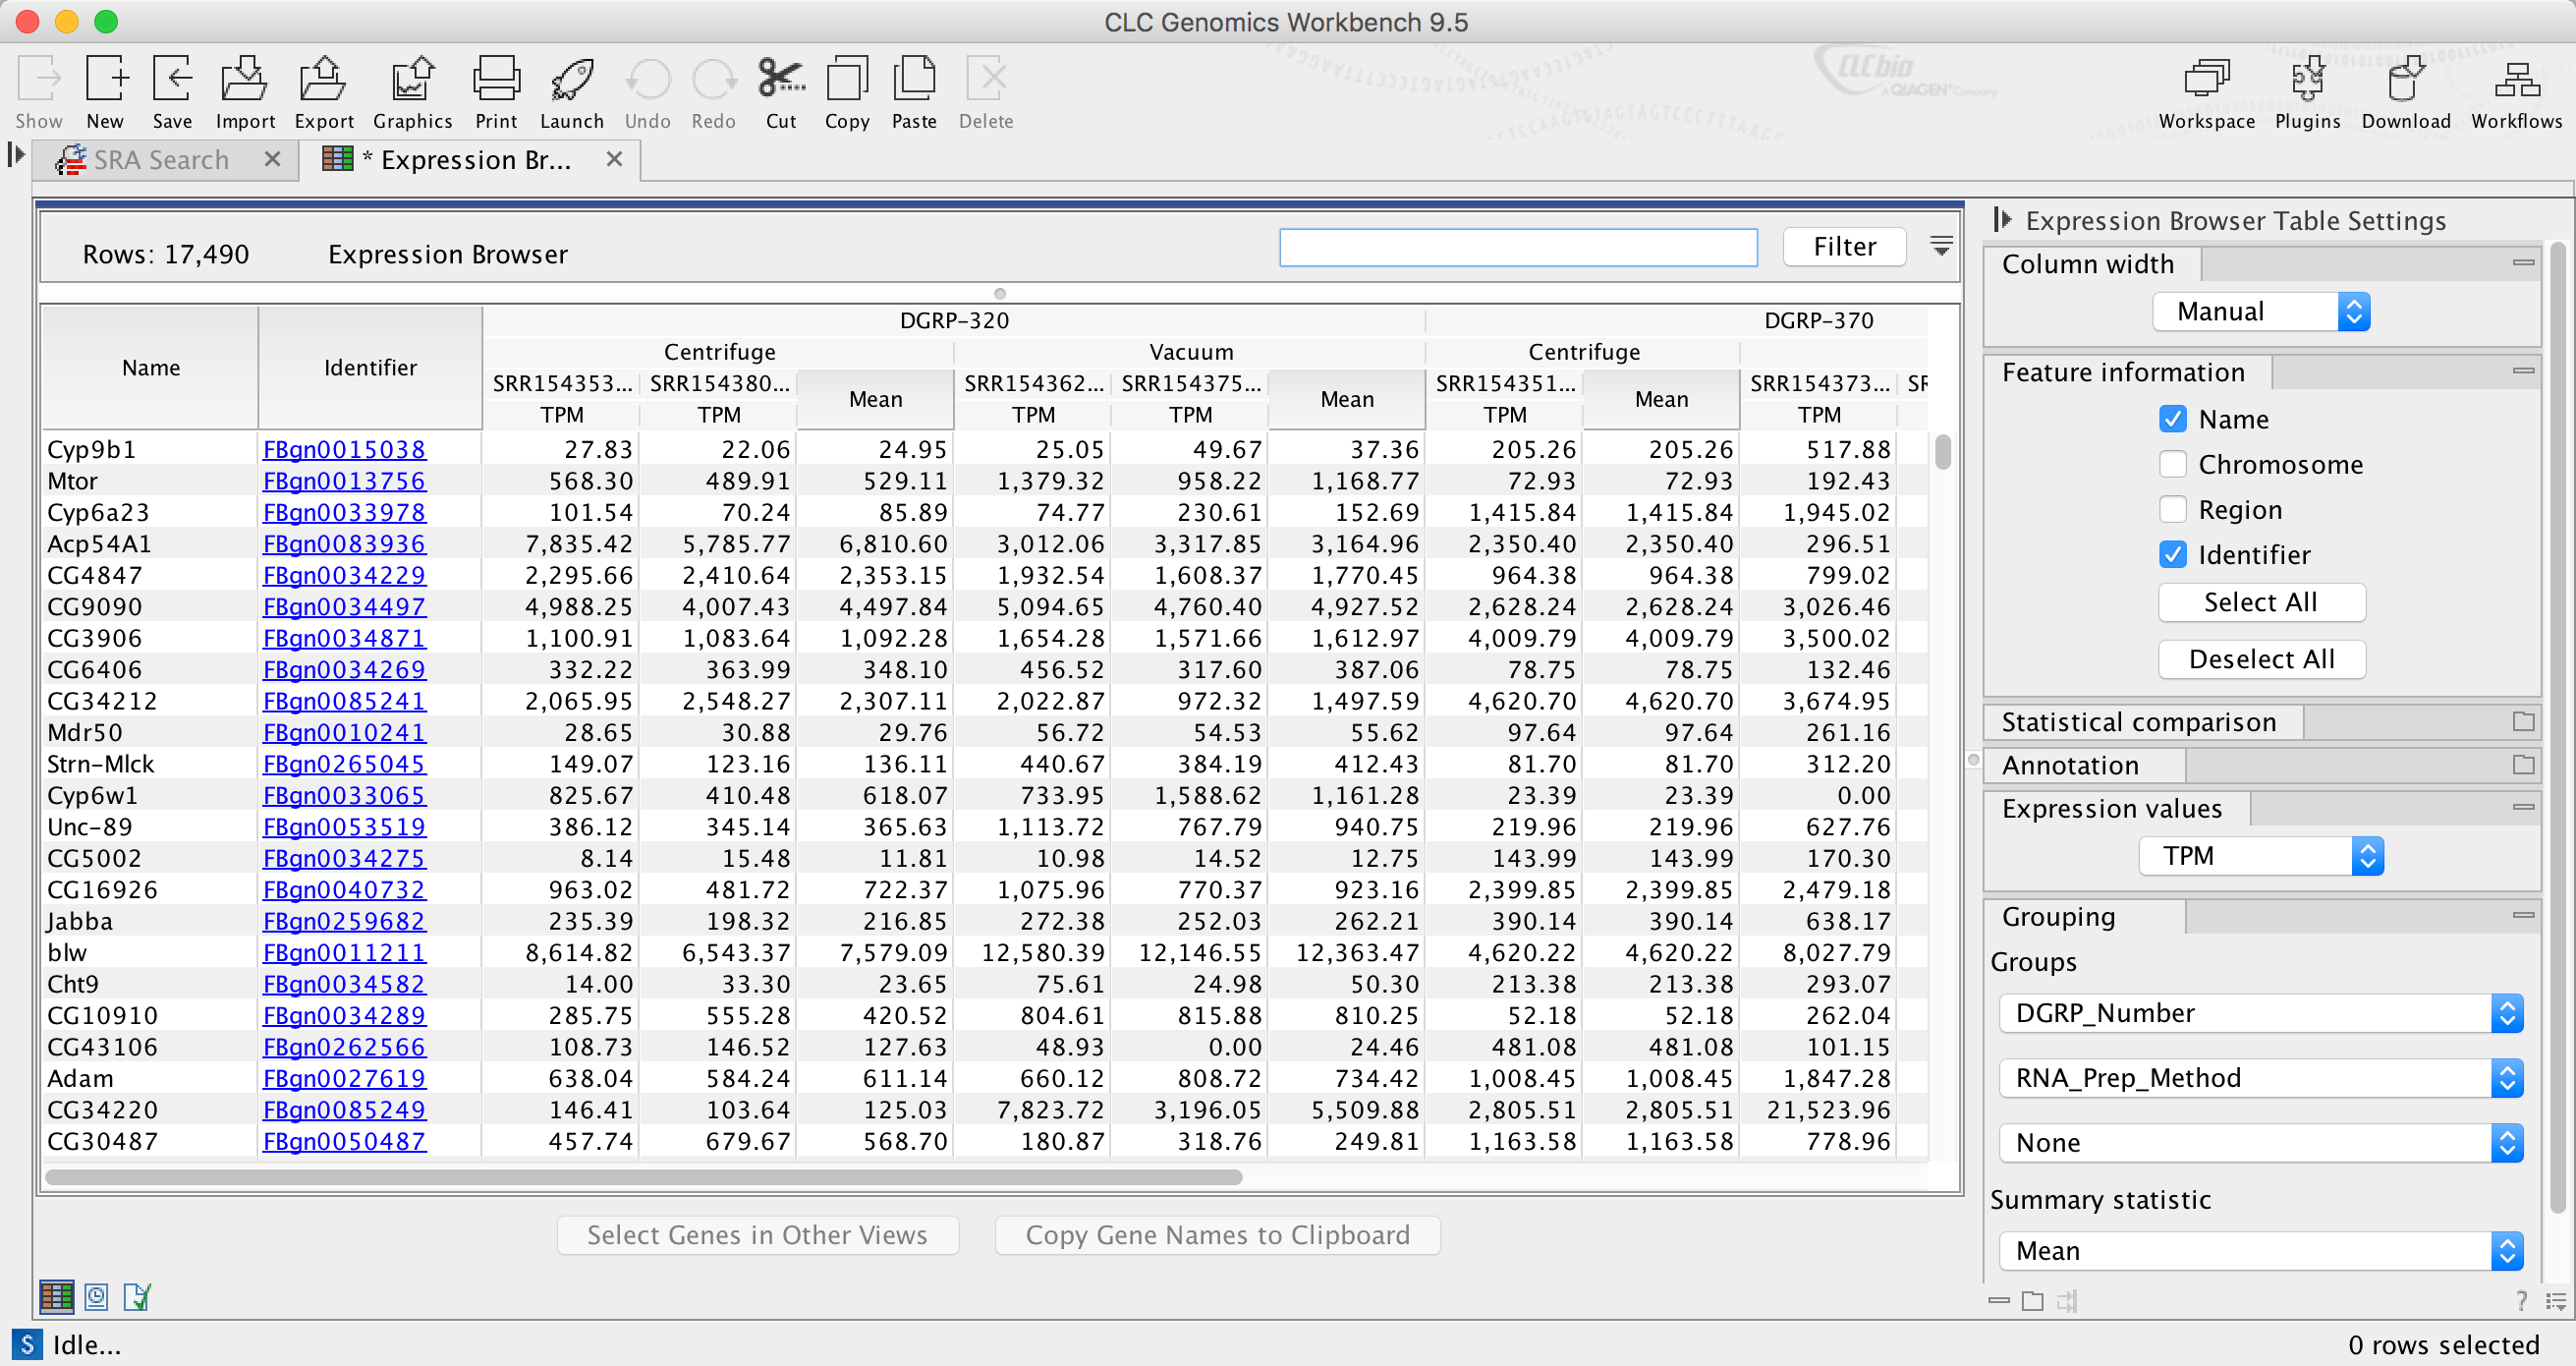
Enhance accuracy and data interpretation for your RNA-seq analysis
We are releasing improved visualizations and statistics. If you have not yet installed the Advanced RNA-Seq plugin, we suggest you give it a try (the plugin is available for CLC Genomics Workbench free of additional costs).
- More powerful genome browsing with expression data
- New tabular expression browser enables grouping of samples by metadata, or switching between different expression values
- Explore gene expression levels in the genome browser view (track list). Enjoy the new color-coding of expression tracks. Coloring according to a log-scale improves the visual interpretation of expression data. Expression track visualizations also dynamically rescale making best use of your screen real estate
- Statistical Comparison Tracks produced by the Advanced RNA-Seq plugin, can now be used for annotating and filtering other tracksExport expression tracks in BED format. The expression value will be exported as the score.
- Improve the accuracy of isoform and gene quantification with a new option In the RNA-seq tool. The option "Use EM estimation (recommended)" uses an expectation-maximization algorithm to distribute ambiguous reads between isoform/genes in a manner similar to RSEM
- PCA plots help you discover factors underlying expression changes. Visualization now available in 2D and 3D

Expression tracks in genome browser (track list) view
Expression browser
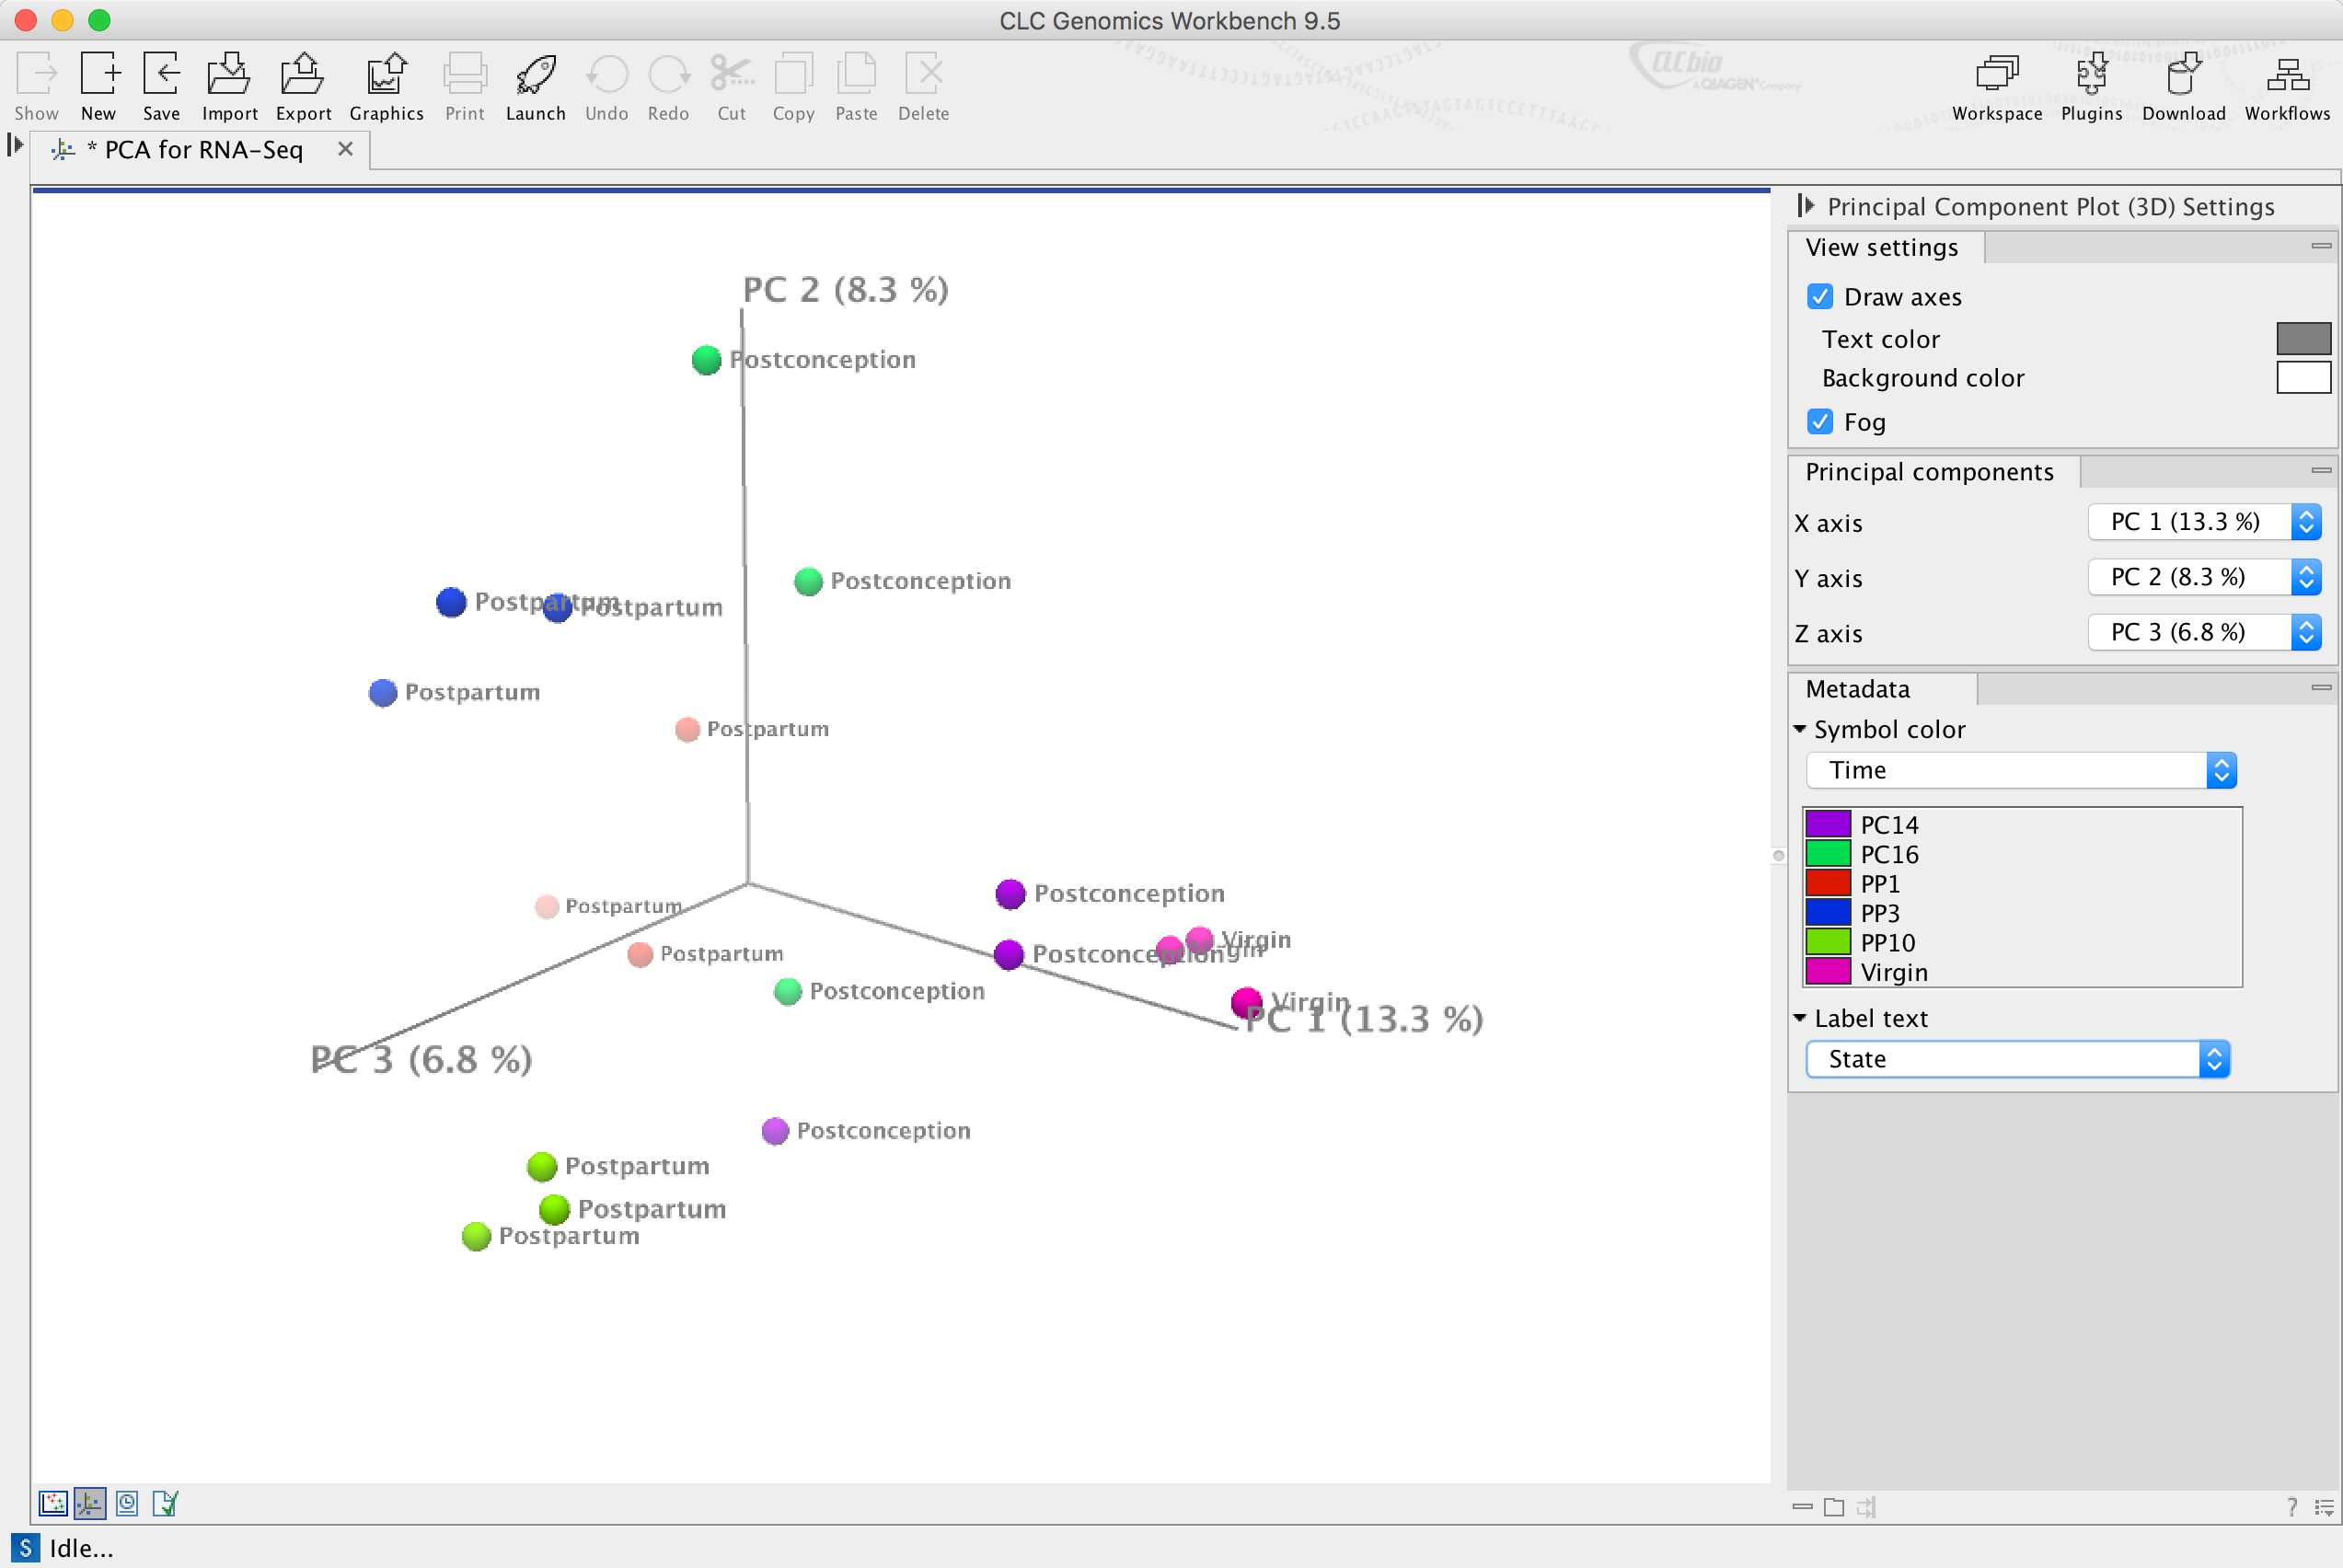
Principal Component Analysis (PCA) plot in 3D grouping samples by similarity in gene expression
New tools for variant analysis and genotyping
- Look up if known genomic variants are present/absent in your sample via the new tool "Identify Known Mutations from Sample Mapping”. The tool is available from the "Resequencing Analysis" folder in the toolbox.
- Identify and extract variants that fulfill certain criteria using the "Identify Candidate Variants" tool. The tool is available from the "Annotate and Filter Variants" folder in the toolbox.
- Detect larger deletions with higher accuracy. We have made enhancements to our tools for local realignment and the detection of structural variants.
GFF3 support
- A new GFF3 importer is available as an option in the Import -> Tracks tool.
Get results faster
- Find and start tools and workflows faster by using the new Quick Launch tool
- We have improved performance for alarge number of tools when run on systems with multiple cores. For more details on this and many other improvements please check the complete release notes for version 9.5