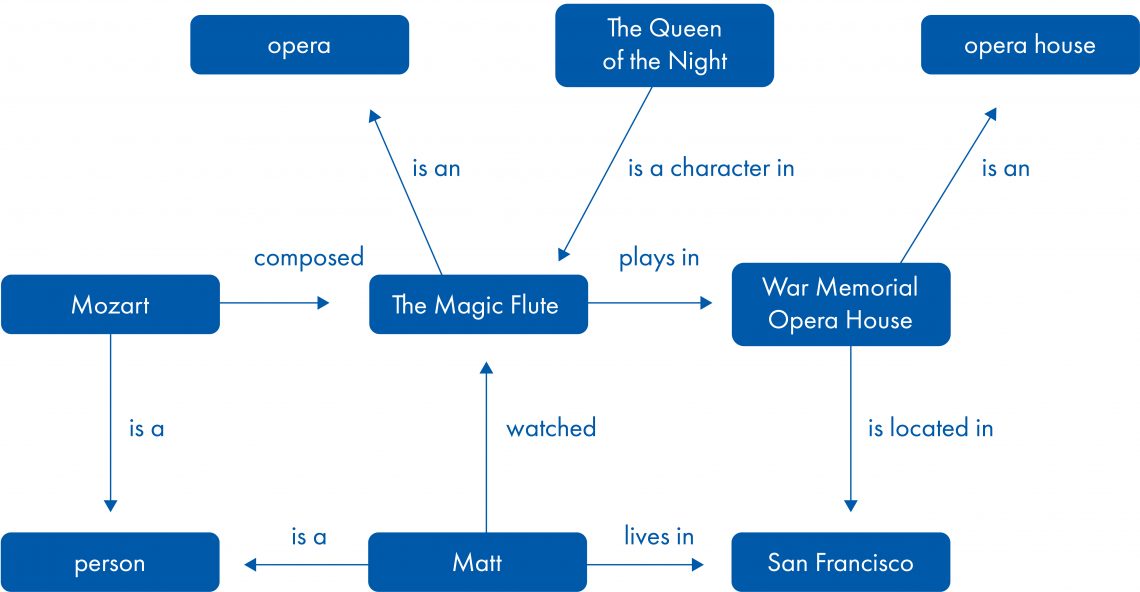
Have you ever done a Google search to find a restaurant or look up what your favorite actor is up to? Most of us have, and therefore understand the benefit of knowledge graphs, possibly without even knowing it. When you do a search on a platform like Google, the information box displayed in the results is made possible by a knowledge graph (1).
Because of their power and versatility, knowledge graphs are rapidly being adopted by the pharmaceutical industry to accelerate data science driven drug discovery. They facilitate integration across multiple data types and sources, such as molecular, clinical trial and drug label data. This enables powerful algorithms to work on various types of data at once, for applications ranging from prioritizing novel disease targets to predicting previously unknown drug-disease associations.
What is a knowledge graph?
A knowledge graph combines entities of various types in one network. These entities are connected by multiple types of relationships. Both entities and relationships can also carry additional attributes. Entities and attributes may also be part of an ontology (2, 3).

Figure 1. A simple example of a knowledge graph.
In the biomedical domain, entities represented in a knowledge graph can be, for example, molecules, biological functions and diseases or phenotypes. Relationships include molecular interactions, gene-functional associations, and drug-target interactions among others. Both entities and relationships are supported by underlying scientific evidence. Simple graphs are undirected, while more powerful graphs include causal relationships to allow causal inference.
Knowledge graph analytics
In drug discovery, knowledge graphs are used for target prioritization and drug repurposing. These tasks frequently involve link prediction approaches that allow the prediction and scoring of relationships between entities that were not explicitly present in the graph before. Artificial intelligence (AI)-inspired methods that have been used for this purpose include tensor factorization (4) and various deep-learning algorithms (see (5) for an example).
The QIAGEN biomedical knowledge graph
QIAGEN Biomedical Knowledge Base is ideally suited to build a large-scale biomedical knowledge graph. It is founded on a vast collection of diverse relationships between biomedical entities of various types. The relationships were manually curated from peer-reviewed biomedical literature and integrated from third-party databases with the highest accuracy.
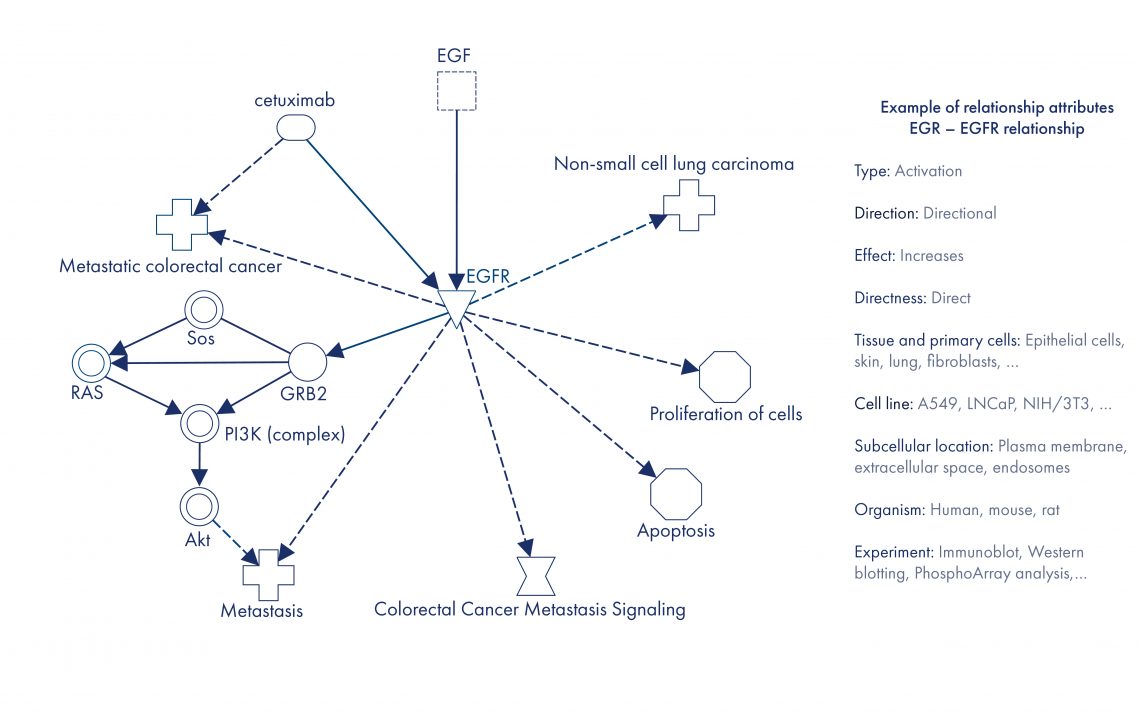
In a knowledge graph constructed from QIAGEN Biomedical Knowledge Base, the main entities connected by relationships are molecules, drugs, targets, diseases, variants, biological functions, pathways, locations and more. The relationships have multiple attributes, including relationship type, direction, effect, context and source. Causality of the relationships is represented through direction. Causal relationships frequently carry information about the direction of effect (activation and inhibition) that can be leveraged in powerful analytics. Relationships are annotated with the full experimental context (e.g., tissues or organism). Entities also have attributes; for example, they are mapped to public identifiers and synonyms to support data integration.

Figure 2. Example of a sub-graph constructed from the QIAGEN biomedical knowledge graph. In this knowledge graph representation, gene and gene product entities are aggregated at the ortholog cluster level. Relationships between the same entities and with the same type, direction and effect are aggregated as well. Cetuximab is a metastatic colorectal cancer drug. EGFR is a target of cetuximab. Molecular interactions in the graph enable you to reconstruct a pathway between EFG, EGFR and the pathological process metastasis. EGFR is also a known member of the canonical pathway Colorectal Cancer Metastasis Signaling. In addition to metastatic colorectal cancer, genetic alterations of EGFR are involved in other diseases, for example non-small cell lung carcinoma. Activation of cell proliferation and inhibition of apoptosis by EGFR are known oncology mechanisms.
QIAGEN knowledge graph research for drug discovery
We actively use our QIAGEN biomedical knowledge graph in drug discovery projects in collaboration with industry partners, and develop new knowledge graph analysis approaches.
For example, we developed a machine learning approach for link prediction (6) that uses our knowledge graph to identify and prioritize genes and biological functions for a given disease. Using our biomedical knowledge graph and this machine-learning approach (7), we prioritized genes linked to known clinical manifestations of COVID-19 and built networks connecting those genes to SARS-CoV-2 viral proteins via protein-protein interactions. Based on these networks, we identified about 450 drugs potentially interfering with viral-host interactions, 54 of which were involved in clinical trials against COVID-19. We further used this approach and our QIAGEN biomedical knowledge graph to develop over 1500 machine-learning-generated disease networks, such as this one on pulmonary hypertensive arterial disease.
Learn more about how QIAGEN Biomedical Knowledge Base enables biomedical knowledge graph construction and analysis to fuel your data- and analytics-driven drug discovery. Request a trial to discover how this powerful tool will transform your drug discovery research.
References
- Sullivan, Danny (May 16, 2012) Google launches knowledge graph to provide answers, not just links. Search Engine Land. Accessed Feb. 18, 2022. https://searchengineland.com/google-launches-knowledge-graph-121585
- CFP: Special Issue on Knowledge Graphs. Tuesday, Sept. 23, 2014. Journal of Web Semantics. Accessed Feb. 18, 2022. https://www.websemanticsjournal.org/2014/09/cfp-special-issue-on-knowledge-graphs.html
- Hogan, A., et al. (2020). Knowledge graphs. arXiv [cs.AI]. arXiv. http://arxiv.org/abs/2003.02320.
- Paliwal, S., et al. (2020). Preclinical validation of therapeutic targets predicted by tensor factorization on heterogeneous graphs. Scientific Reports 10 (1): 18250.
- Zitnik, M., et al. (2018). Modeling polypharmacy side effects with graph convolutional networks. Bioinformatics 34 (13): i457.
- Krämer, A., et al. (2021). Mining hidden knowledge: Embedding models of cause-effect relationships curated from the biomedical literature. bioRxiv 2021.10.07.463598
- Krämer, A., et al. 2021. The coronavirus network explorer: Mining a large-scale knowledge graph for effects of SARS-CoV-2 on host cell function. BMC Bioinformatics 22 (1): 229.

