
Isoform View
Next-generation sequencing (NGS) technologies generate millions of reads and hundreds of datasets, and the need for a better way to accurately interpret and distill such large amounts of data has never been more acute. IPA helps you put this data into a biological context and quickly focus in on the most relevant genes to better understand the biological implications of your experiment. RNA-Sequencing (RNA-Seq) capabilities in IPA enable you to upload, analyze and visualize your processed RNA-Seq datasets for enhanced biological insights, helping to standardize RNA-Seq data analysis and interpretation results.Highlights
Upload processed RNA-Seq datasets directly into IPA to analyze and understand RNA-Seq data in the context of known biology to get a comprehensive view of your experimental system.
- Seamlessly move from data processing tools to biological interpretation by directly uploading RefSeq, Ensembl, or UCSC IDs into IPA.
- Quickly move beyond statistical analysis of high-throughput RNA-Seq data to understand the biological implications of your data, so you can accurately identify novel disease mechanisms, prioritize drug targets, generate hypotheses, and more.
- Identify significantly regulated isoforms in your experiment and determine their potential impact using information about functional protein domains and isoform-specific literature
Capabilities
Understand the biological implications of RNA-Seq data.
RNA-Seq capabilities in IPA enable you to upload, analyze and visualize your processed RNA-Seq datasets for enhanced biological insights, helping to standardized RNA-Seq data analysis and interpretation results. This process gives verifiable and trusted insights into biological functions, biomarkers, disease mechanisms, therapeutics, canonical pathways, subcellular location, functional gene family, and pathways associated with your data.
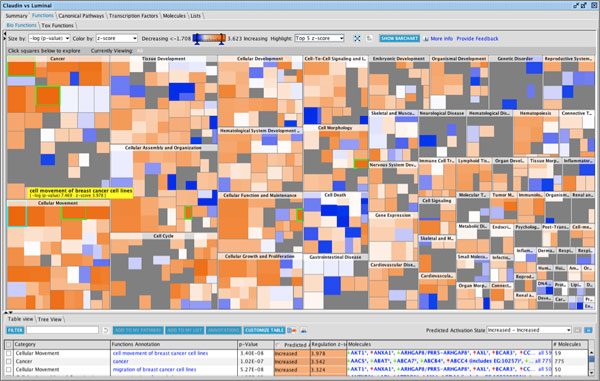
Epithelial to mesenchymal transition (EMT) and the reciprocal mesenchymal to epithelial transition (MET) are key processes involved in both tumor metastasis and stem cell differentiation and development. Here the Downstream Effects analysis in IPA enables scientists to visualize the effect of gene expression changes on downstream biological processes and diseases. Gene Expression Profiles for Claudin-low, Basal, and Luminal cell lines representing three breast cancer subtypes using RNA-Seq methodology shows a predicted increase in the Cellular Movement biological process.
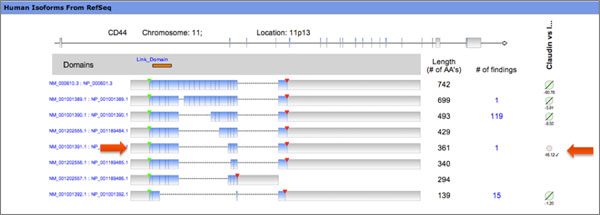
IPA displays the expression results for each isoform from the EMT RNA-Seq dataset on the Human Isoform View which is accessible on Gene Views. CD44s accelerates EMT and breast cancer progression, and is overexpressed in tumors. The CD44 protein isoforms are involved in proliferation, adhesion, and migration. The Human Isoform View shows the alternatively spliced version (CD44s) is missing all variable exons & is important in EMT.
Upload RNA-Seq identifiers directly into IPA and automatically map to genes.
IPA permits the direct upload of the following identifier types:
- RefSeq IDs
- Ensembl IDs
- UCSC IDs
You can upload pre-calculated metrics (fold changes, ratios, p-values, etc.) on a gene or transcript level. Raw short read data must be processed into isoform or gene-level models with upstream partner software, assigned expression values then uploaded into IPA. IPA automatically maps Ensembl and USCSC IDs to the corresponding ReqSeq ID to display associated expression results on the Isoform View. The ability to upload these IDs directly into IPA is valuable because it lets you move directly from data processing to data interpretation using the same IDs, avoiding mapping issues that can arise when moving data between analysis tools.
Leverage a strong next-generation sequencing partner program.
Ingenuity has a partnership program with upstream next-generation sequencing providers. These integrations with IPA enable powerful workflows that help you quickly and accurately distill millions of reads and hundreds of datasets down to a manageable list of the most interesting and relevant genes, isoforms, and variants. These datasets can be brought into IPA, where you can obtain the biological context necessary to narrow in on what is most important in your dataset, helping you get to the intended high-value results of biomarker identification, target ID and validation, understanding drug mechanism of action, and safety assessment.
Supported Partners:
- CLC Bio
- SAS JMP Genomics
- Partek
- Galaxy
- Agilent GeneSpring
Taking advantage of IPA for next-generation research.
IPA is leveraged in cutting-edge NGS research institutions. Using Ingenuity’s IPA software and the Ingenuity® Knowledge Base, researchers are able to map and contextualize genes and variants related to biological processes, functions, diseases, pathways, compounds, and relationships, and obtain a more complete biological picture from their NGS data.
For example, researchers at Harvard Medical School are using IPA and the new Human Isoform View to better understand the isoform-specific biology resulting from RNA-Seq experiments.
“I use IPA to put the findings from my RNA-Seq experiments into context. It helps me visualize pathways of interest that can be followed-up with validation experiments. The new human isoform function is great at displaying expression levels and fold changes on a per isoform scale.” – J. Daniel Muehlschlegel, MD, MMSc
Assistant Professor of Anesthesia
Brigham and Women’s Hospital, Harvard Medical School